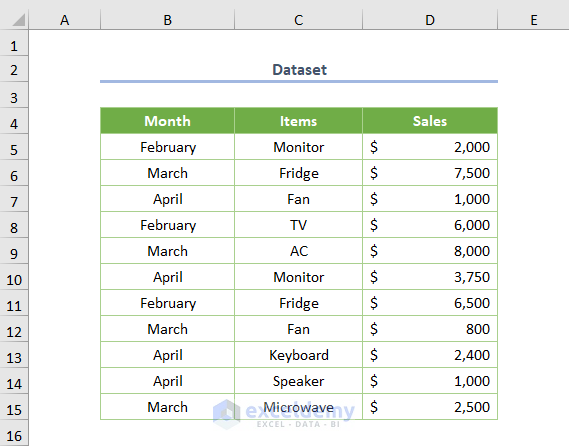
The dataset showcases Items and Sales over three months. To calculate the running total by group (Month), choose a month:
Method 1 – Running Total by Group
Step 1: Opening the Power Query Editor
- Select the dataset and go to the Data tab.
- In Get & Transform Data, choose From Table/Range.
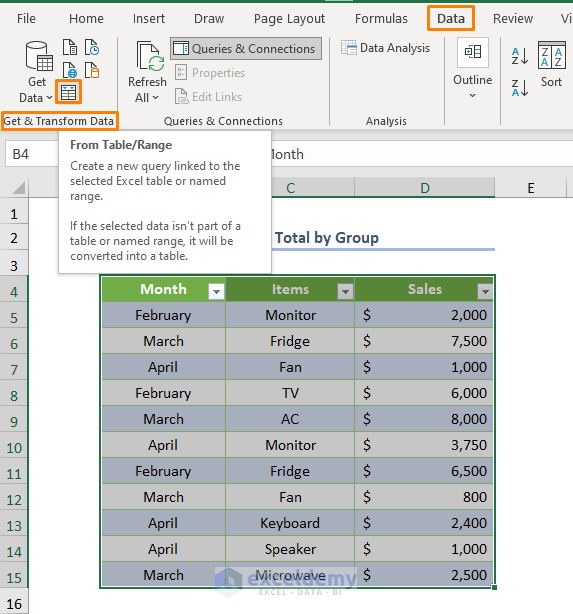
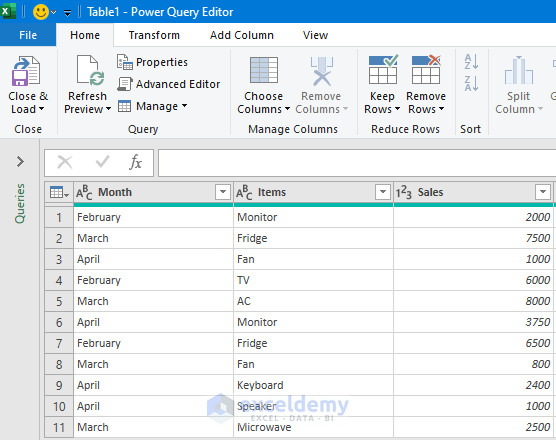
- The following window will be displayed.
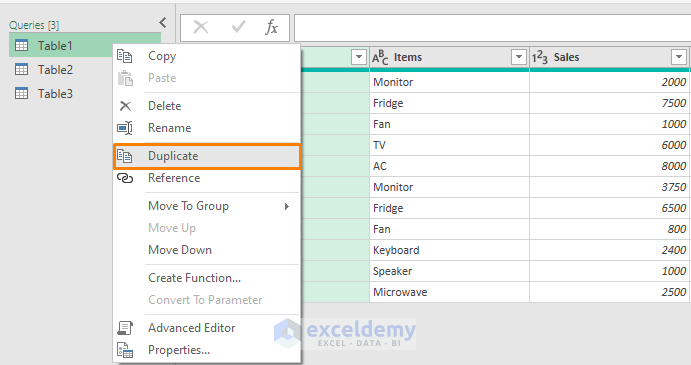
Note: To avoid repetitive tasks, you can duplicate Table1 (right-click Table1 and choose Duplicate).
Step 2: Finding the Index
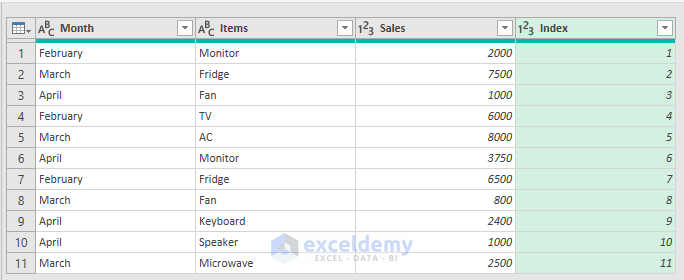
- Go to Add Column tab > Index Column > From 1.
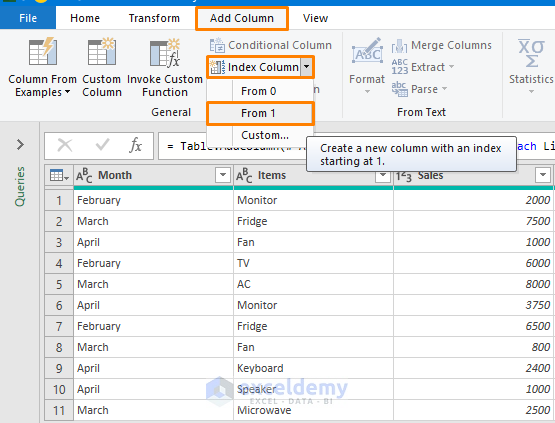
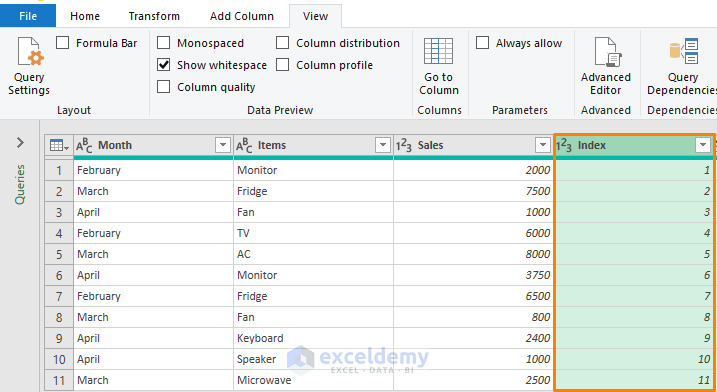
A new column displays the index number for each Item.
Step 3: Determining Running Totals
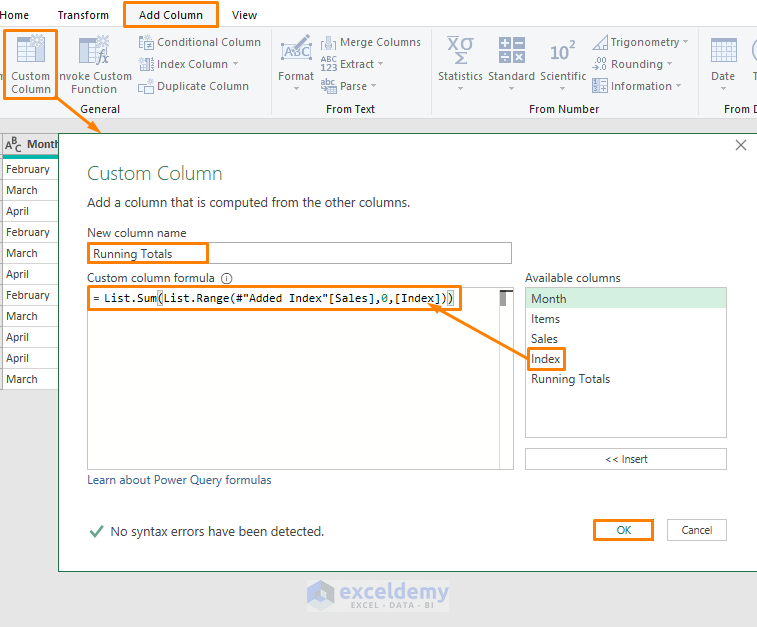
- Click Custom Column in Add Column.
- In the Custom Column dialog box, rename the New column name as Running Totals
- Enter the following formula as shown.
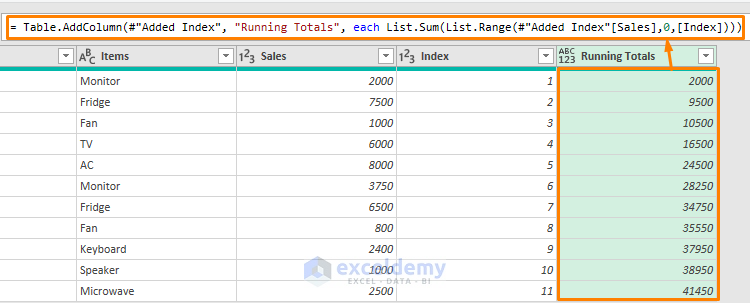
=List.Sum(List.Range(#“Added Index”[Sales],0,[Index]))
The List.Sum function sums the values and the List.Range function defines the range (Sales) and changes it depending on the Index value.
This is the output.
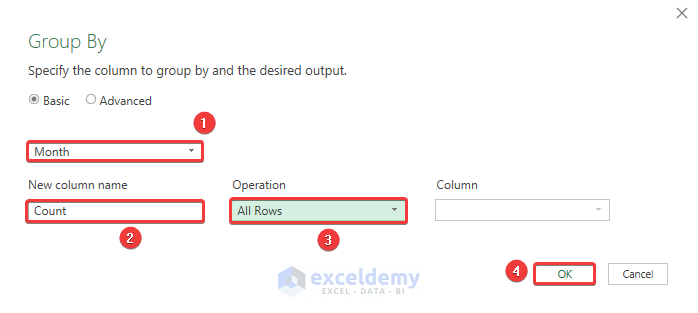
Step 4: Applying the Group By Feature
- Go the Home tab.
- In Transform, select Group By.
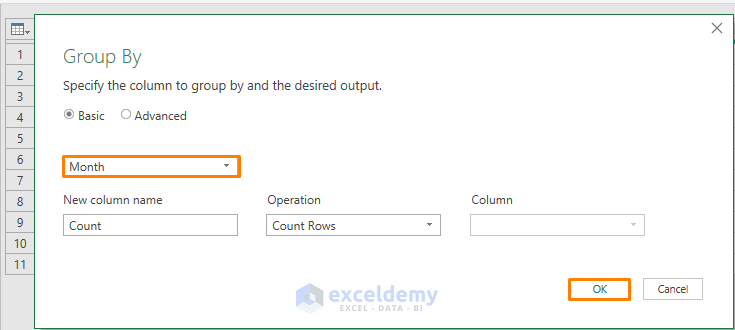
- In the Group By dialog box, choose Month.
- In Operation, choose All Rows.
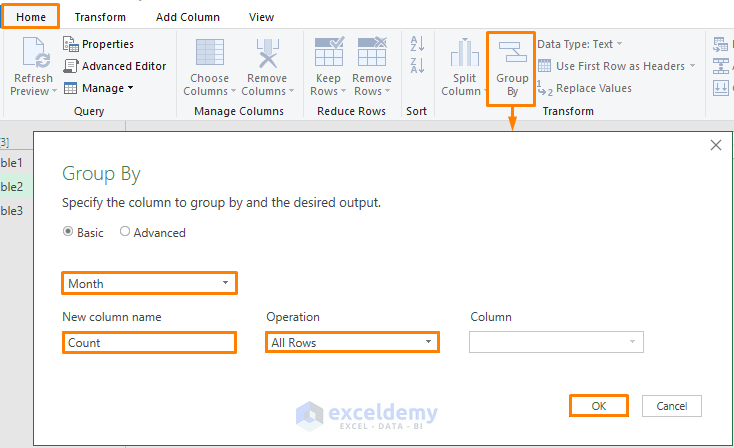
- Click OK.
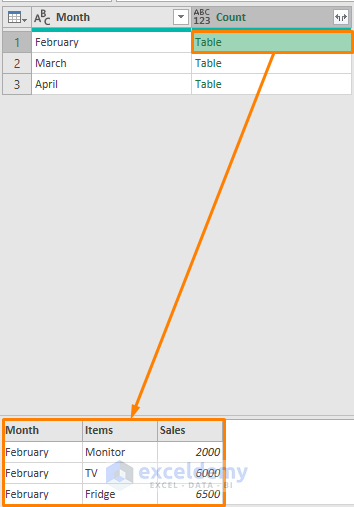
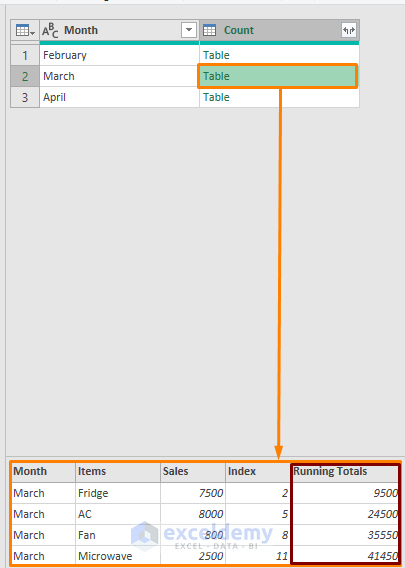
Data is grouped.
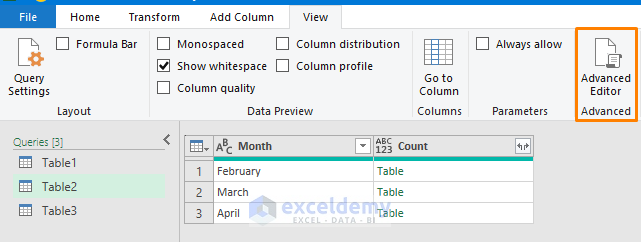
Step 5: Calculating Running Totals by Group
- To find the running totals by group, open the Advanced Editor in the View tab.
- Enter the following code.
let
    Source = Excel.CurrentWorkbook(){[Name="Table2"]}[Content],
    #"Changed Type" = Table.TransformColumnTypes(Source,{{"Month", type text}, {"Items", type text}, {"Sales", Int64.Type}}),
    #"Grouped Rows" = Table.Group(#"Changed Type", {"Month"}, {{"Count", each _, type table [Month=nullable text, Items=nullable text, Sales=nullable number]}}),

   //Function to Compute Running Totals

   RunTotalFunction = (RunTotalTable as table) as table =>
   let
    #"Added Index" = Table.AddIndexColumn(RunTotalTable, "Index", 1, 1, Int64.Type),
    #"Added Custom" = Table.AddColumn(#"Added Index", "Running Totals", each List.Sum(List.Range(#"Added Index"[Sales],0,[Index])))
in
    #"Added Custom",

    //Assigning the Function
    RunTotals = Table.TransformColumns(#"Grouped Rows", {"Count", each RunTotalFunction(_)})
in
    RunTotals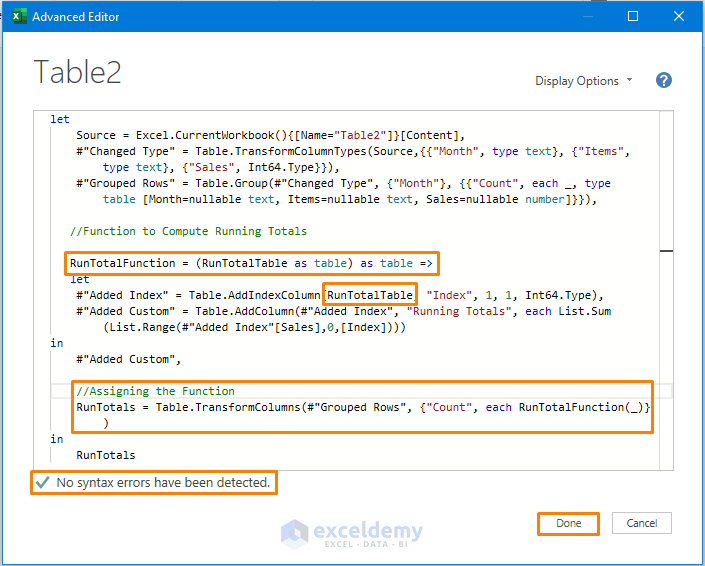
The Runfunction was created to compute the running totals and declare RunTable as a table. The Index for the RunTable column and Running Totals was calculated. (you can copy the code from Table1 and enter RunTable instead of #”Changed Type”).
The function was called and #”Grouped Rows” and “Count” for each Runfunction were assigned to determine the running totals.
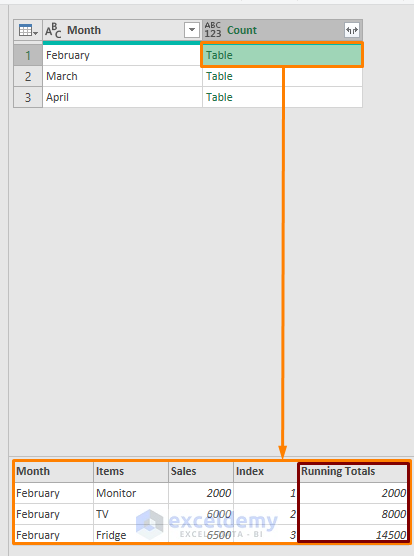
If you click the February Table, you’ll get all information including the running total for that month.
Read More: How to Calculate Running Total in One Cell in Excel
Method 2 – Using the List.Accumulate Function
Step1: Computing Running Totals
- Find the index (as described in Step 2 of the first method) for Table3.
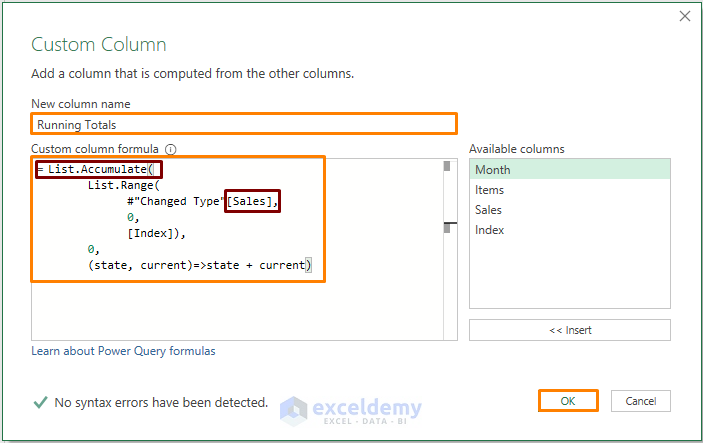
- Add a custom column: Running Totals.
- Enter the following formula.
= List.Accumulate(
      List.Range(
            #"Changed Type"[Sales],
            0,
            [Index]),
      0,
      (state, current)=>state + current)
The List.Accumulate function accumulates the sum of values in the list. The list is defined using the List.Range function in the Sales column.
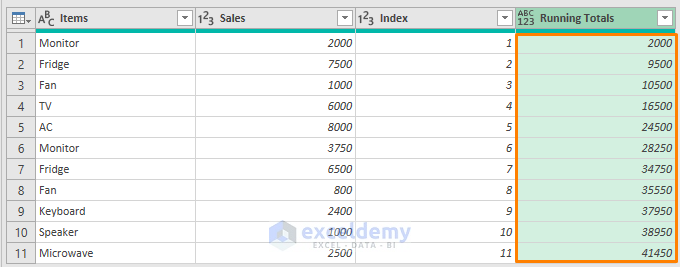
This is the output.
Step 2: Apply the Group By Option
- Choose Month in Group by.
You’ll see the running total by group (month). If you pick any Table from the Count table for any Month, you’ll get the running total for that month.
Practice Section
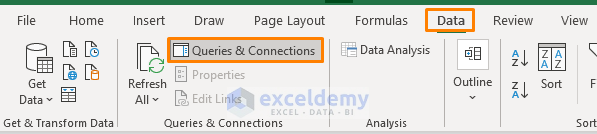
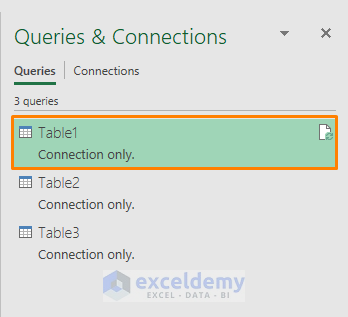
Download the .xlsx file from the Download Practice Workbook section. Go to Queries & Connections in the Data tab.
Click Table1 and practice.
Download Practice Workbook
Related Articles
- Cumulative Sum in Excel If Condition Applied
- Calculate Horizontal Running Total in Excel
- How to Create Running Subtraction Total in Excel
<< Go Back to Excel Running Total | Calculate in Excel | Learn Excel
Get FREE Advanced Excel Exercises with Solutions!

The List.Accumulate method does not appear to be giving the correct running totals by the month.
Hello Michael,
Please specify your problem in detail or send the excel file via [email protected] email address.
Hi, MICHAEL V BERNOT!
Thank you for your query.
You have pointed out a good problem. To solve your problem remove the last bracket from the given Custom column formula in the article above.
And, another thing, choose the All Rows option in the Operation option list instead of Count Rows in the Group By window.
I hope this solves your problem. Stay with ExcelDemy for more Excel tips, tricks, formulas, and solutions.
Regards,
Tanjim Reza
Hi there
Once you have generated the running totals in each of the groups, which are accessed by clicking on the tables created for each group, how do you then combine all of these new tables into one big table so that you can access these running totals?
Hello DONNA ATKINS,
Thank you for your feedback, the answer to your question is provided in the steps below, so follow along.
Step 1. First, complete steps 1 through 5 from Method 1 >> now, follow the steps shown in the live demonstration.
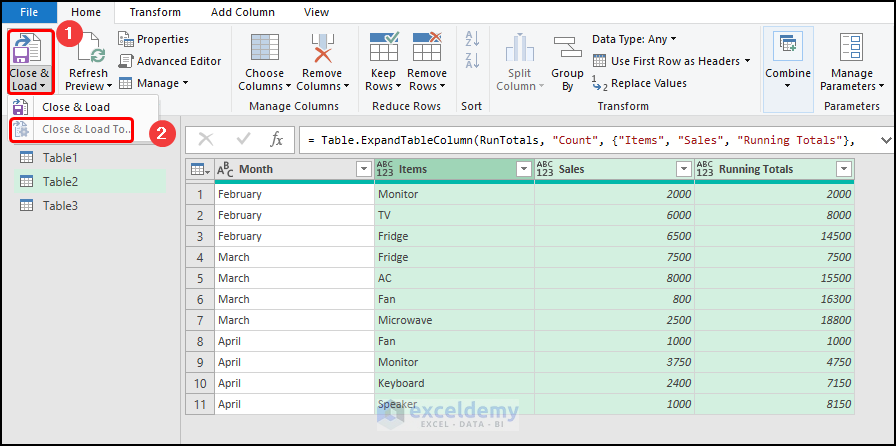
Step 2. Next, click on Close & Load drop-down >> select Close & Load to option.
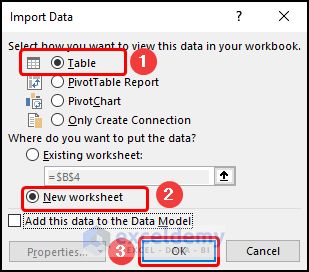
Step 3. Lastly, choose the Table or PivotTable option according to your preference >> load this data into a new worksheet.
Hopefully, this solves your problem. Have a good day.