Latest Posts From Souptik Roy

We have a dataset called Product Price of ABC Traders. The dataset has two columns, B and C, called Product and Price. The Product column refers to the product ...
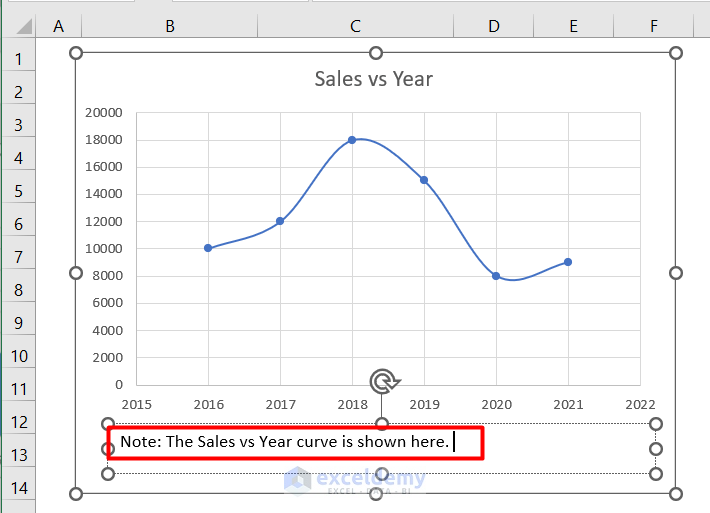
We will consider a dataset of Sales of ABC Traders from B4 to C10. We will add a chart and add a comment on it. Method 1 - Adding a Comment on a ...

While using Excel, you may need to use the text-to-columns option in Excel. This option can be used for many activities. In this article, I will show you how ...

A derivative is a common tool to calculate any rate of change of any value. You can calculate derivatives by using Excel. In this article, I will show how to ...

The dataset showcases Employee name, Joining Date, and Ending Date. Method 1 - Using the YEARFRAC Function to Calculate the Prorated ...

Sometimes, you need to calculate probability with your database. You can calculate this probability using Excel. In this article, I will show how to calculate ...
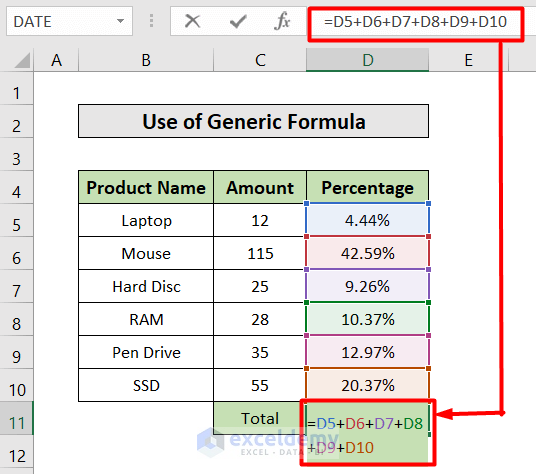
To demonstrate our methods, we'll use the following dataset: Method 1 - Using a Generic Formula We add a new row to calculate the total percentage. ...

In this article, we will explain how to lock the borders of a table in a few easy steps. Step 1 - Creating a Dataset To start with, we need a table whose ...

Method 1 - Using Generic Formula to Convert Date of Birth to Age in Excel In our sample database, we added two new columns, D & E called Current Date and ...

When working in Excel, you need to do many kinds of operations. One of the most common operations is to make a sum of a column or a row. Calculating the sum of ...

Charts are very important tools to visualize and represent data attractively. While working with Excel charts, sometimes you need to Align the charts in Left, ...

Below is a dataset on the Bill Report of ABC Company. The dataset has three columns: Customer ID, Name, and Status. Penny's status is unknown, and ...

In Excel, we use to solve different types of real-life problems. One of them is to Calculate the Average of Averages. In real life, an Average of averages or ...

To perform calculations and retrieve data based on the values in specific cells, you must know how to use a cell address in Excel Formula. However, it can be ...

The dataset, Sales Report of ABC Traders, has 2 columns indicating Days and Sales. We will look at 3 easy steps for showing equations in an Excel graph. ...
See Our Reviews at

