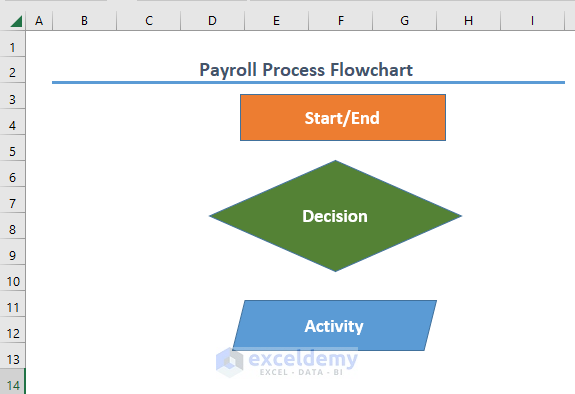
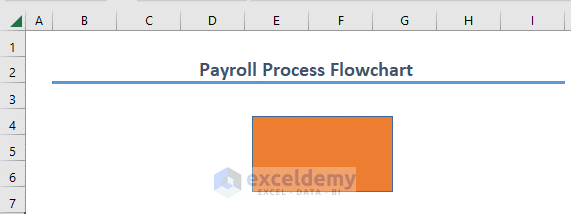
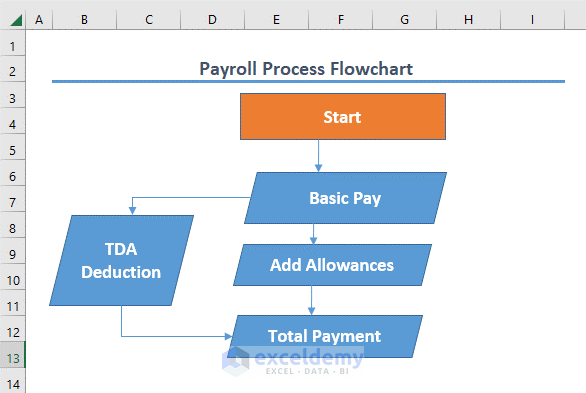
In a Flowchart each element in the diagram has different shapes. For example, a Rectangle indicates the Start or End of a flowchart. Other shapes have different meanings.
Step 1 – Calculate the Basic Pay
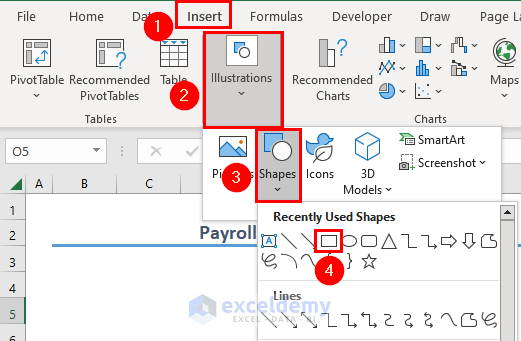
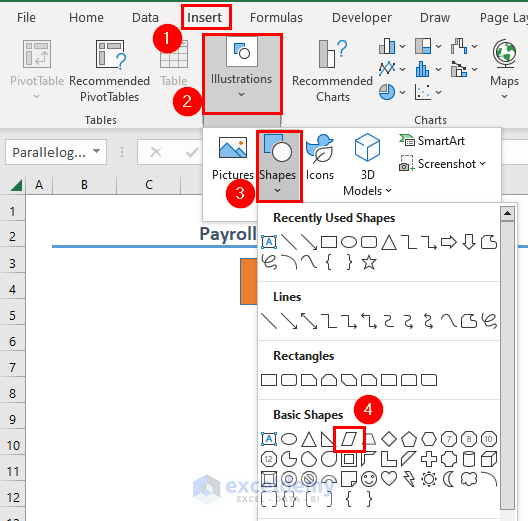
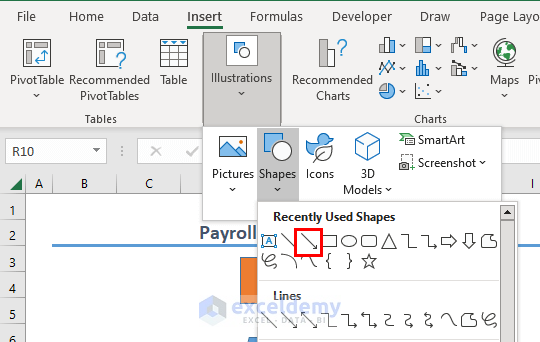
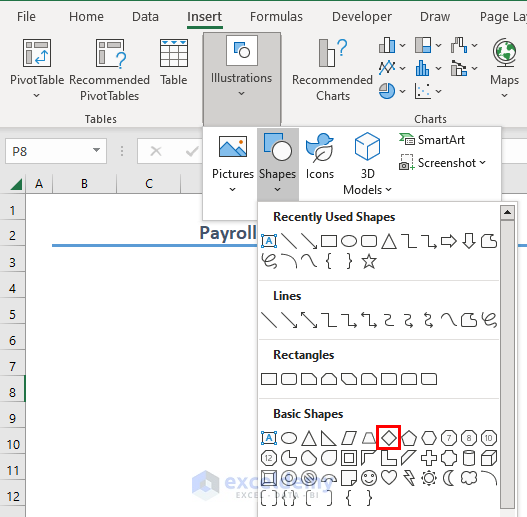
Create the flowchart diagram.
- Go to the Insert tab.
- Click Illustrations.
- Go to Shapes.
- Select Rectangle.
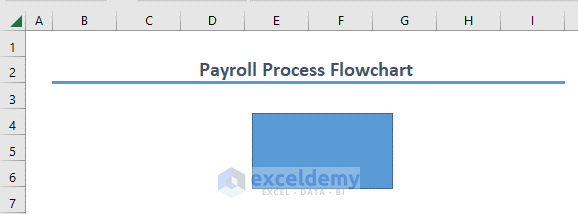
- Place the rectangle.
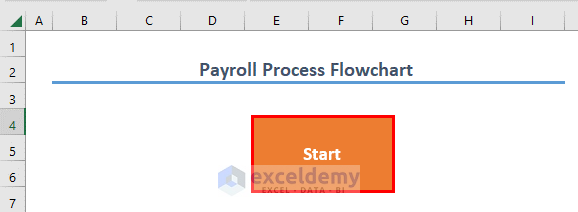
Change the fill color:
- Select the rectangle and go to the Home tab.
- Select Fill Color.
- Choose a color.
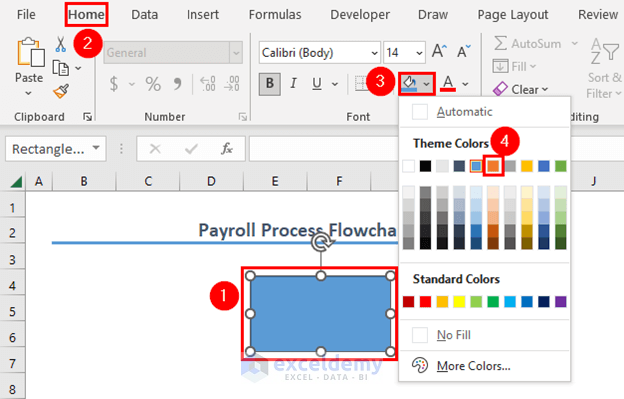
Excel will change the Fill Color.
- Double-click inside the rectangle to activate the editing mode.
- Enter ‘Start’.
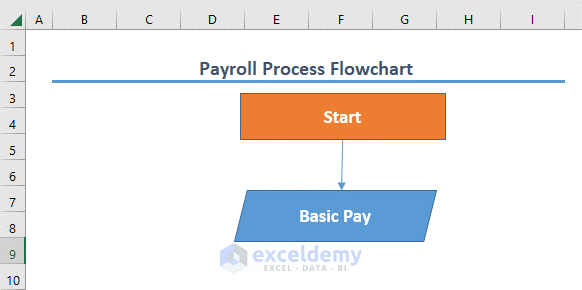
Add the calculation of the basic pay to the chart:
- Go to the Insert tab.
- Click Illustrations.
- Go to Shapes.
- Select Parallelogram.
- Place the Parallelogram and enter ‘Basic Pay’ after activating the editing mode.
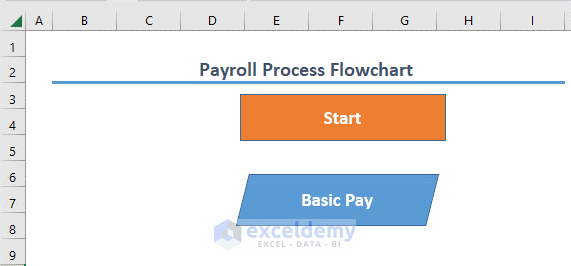
- Use the Arrow in Shapes to show the sequence.
This is the flowchart diagram:
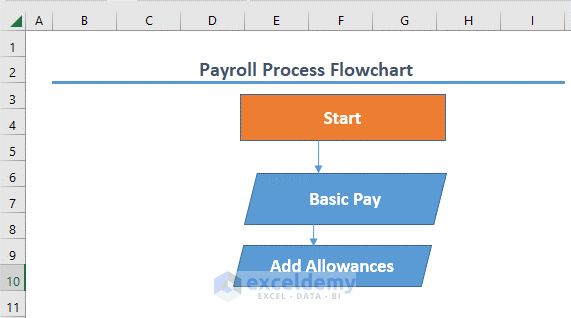
Step 2 – Measure Allowances
Consider the allowances:
- House allowance
- Transportation allowance, etc.
- Add another rectangle.
- Enter ‘Add Allowances’ in the rectangle.
This is the output:
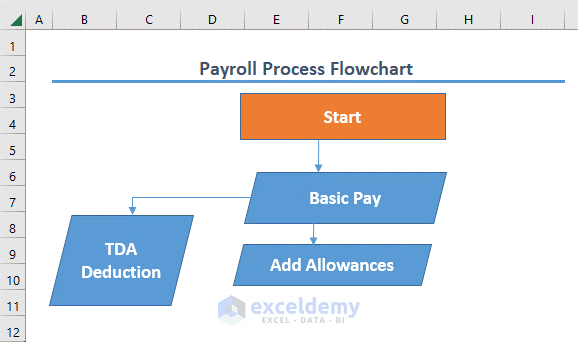
Step 3 – Deduct the TDA
Calculate the Tax Deducted at Source. Deduct any other dues.
- This is the output:
Step 4 – Calculate the Total Payment
The total payment is the result of the addition of all allowances to the basic pay and the deduction of all dues from the basic pay.
- Insert a rectangle.
- This is the output:
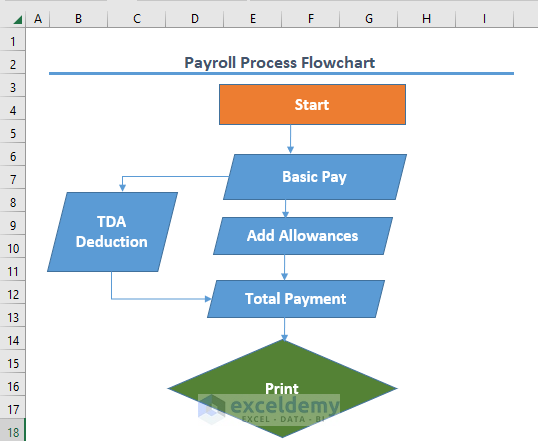
Step 5 – Add a Print Statement
- Choose the Diamond shape.
- Edit it.
This is the output.
Step 6 – Complete the FlowChart
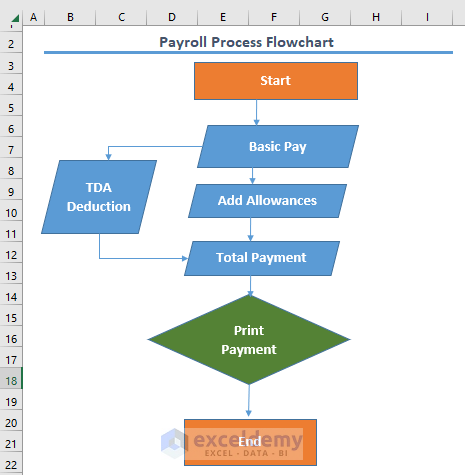
- Add the End rectangle to complete the flowchart.
Download Practice Workbook
Download the file and practice.
Related Articles
<< Go Back to Excel Payroll Templates | Excel HR Templates | Excel Templates
Get FREE Advanced Excel Exercises with Solutions!
