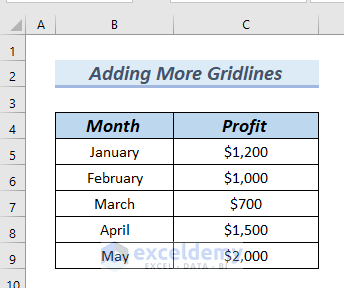
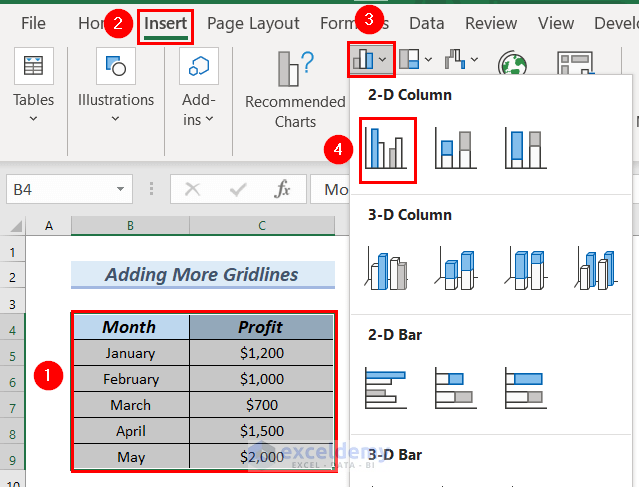
Use the dataset below to insert a Column chart:
- Select the entire dataset.
- Go to the Insert tab.
- In Insert Column or Bar Chart >> select 2D Clustered Column chart.
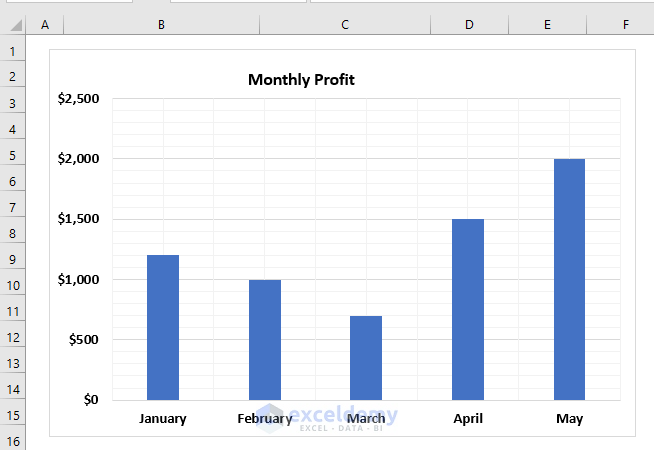
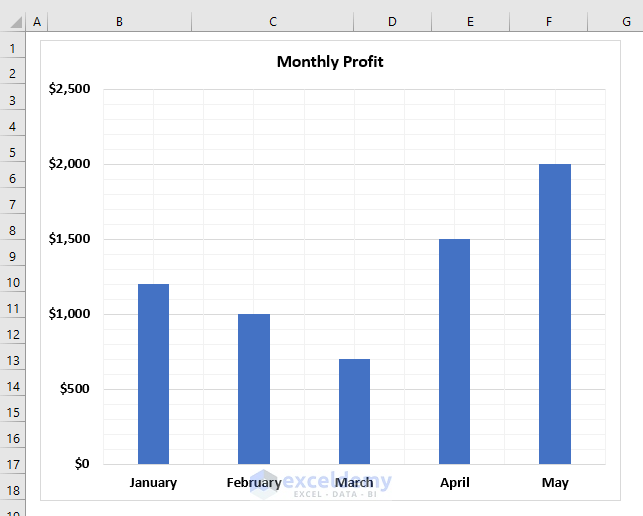
The column chart is created.
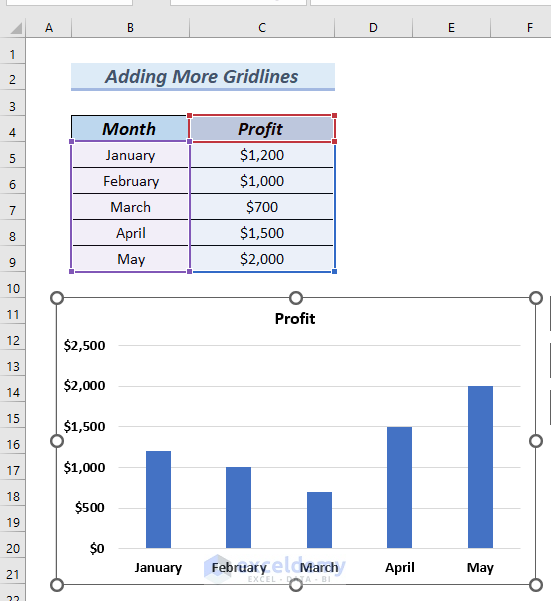
- Change the Chart Title to Monthly Profit.
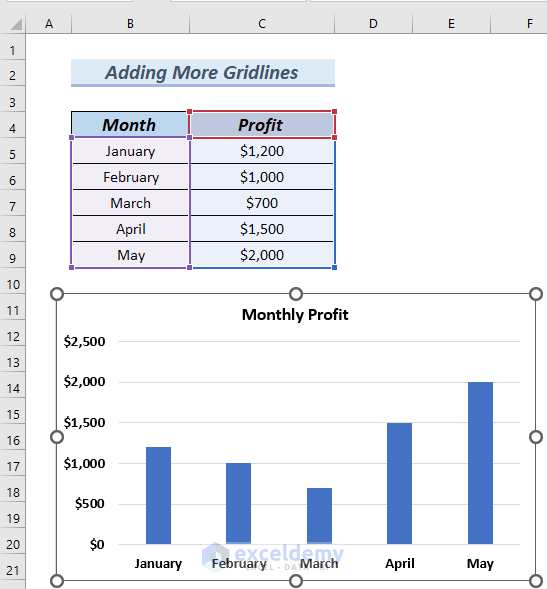
Horizontal gridlines were automatically created. To add more gridlines to the chart:
Method 1 – Using the Add Chart Elements Option to Add More Gridlines in Excel
Step 1: Adding More Gridlines
- Click the chart >> go to the Chart Design tab.
- In Chart Layouts >> click Add Chart Element.
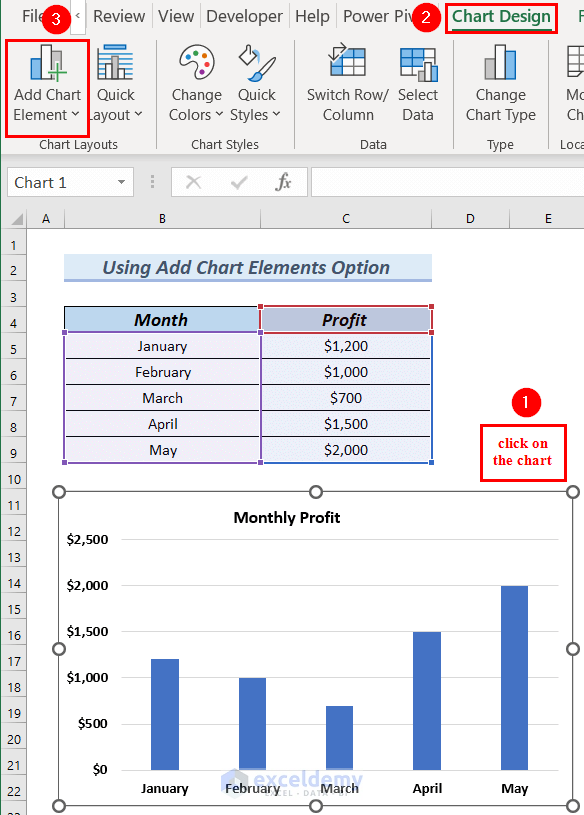
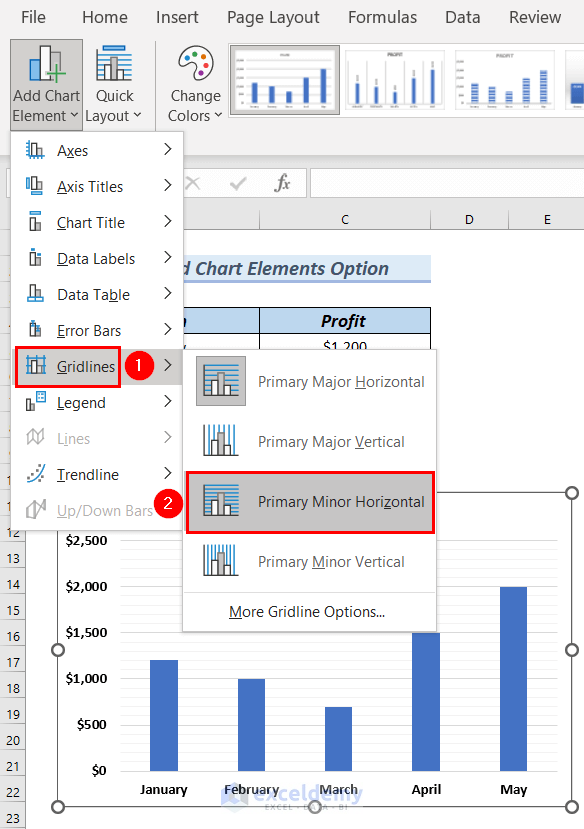
- Click Gridlines.
- Select Primary Minor Horizontal.
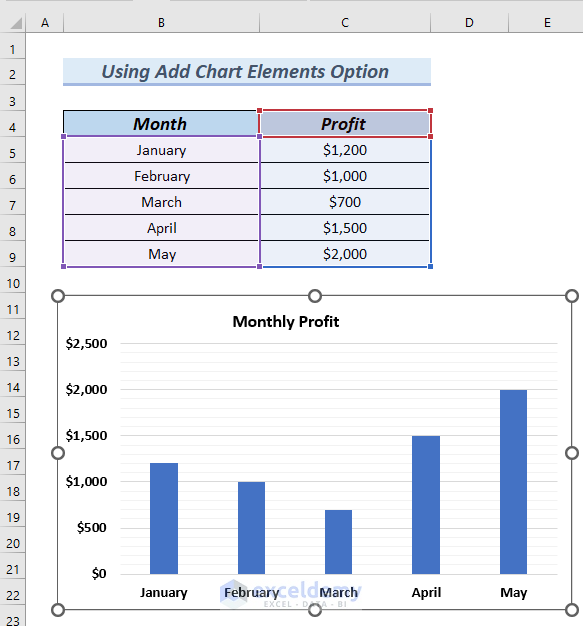
The chart displays more horizontal gridlines:
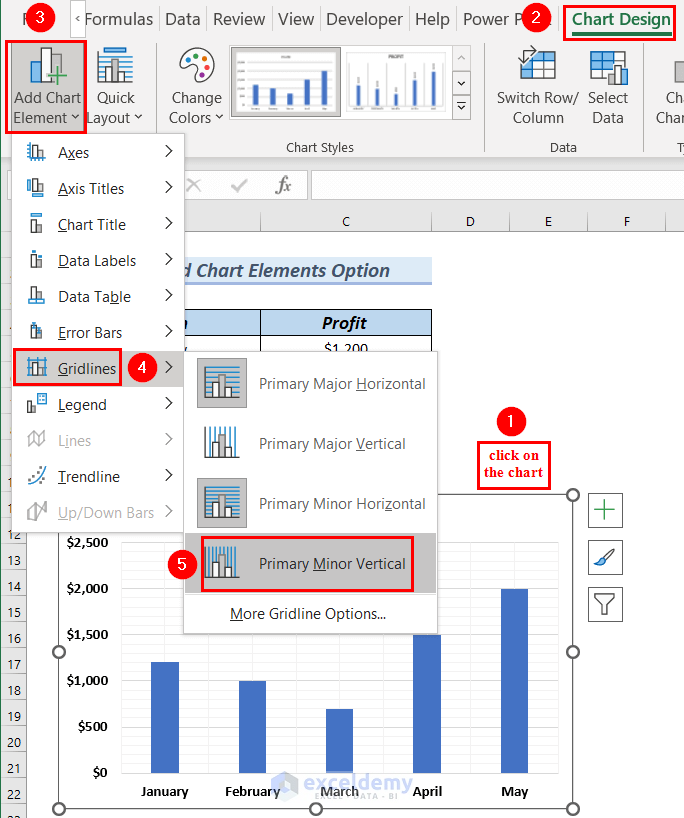
To add Primary Minor Vertical gridlines:
- Click the chart >> go to the Chart Design tab.
- In Chart Layouts >> click Add Chart Element.
- Click Gridlines.
- Select Primary Minor Vertical.
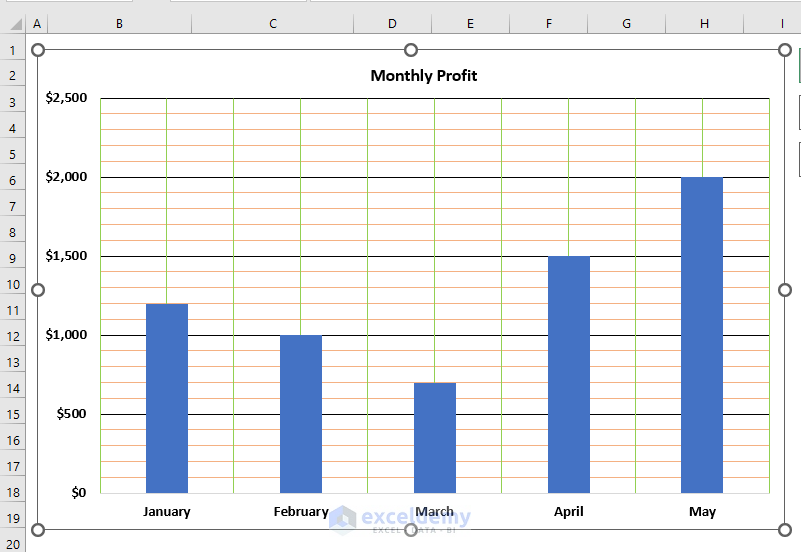
You can see the added horizontal and vertical gridlines.
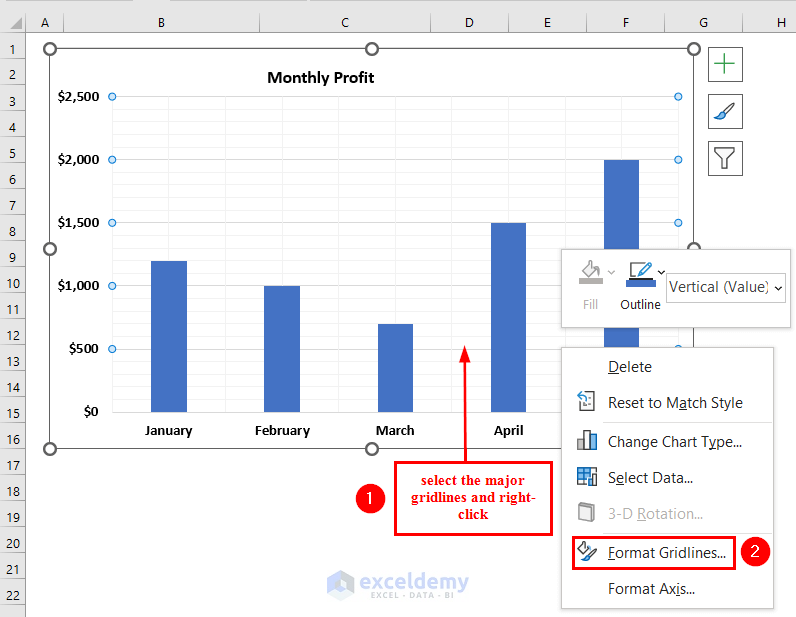
Step 2: Formatting the Gridlines
To format the horizontal major gridlines.
- Click one of the major gridlines, and all major gridlines will be selected.
- Right-click >> select Format Gridlines.
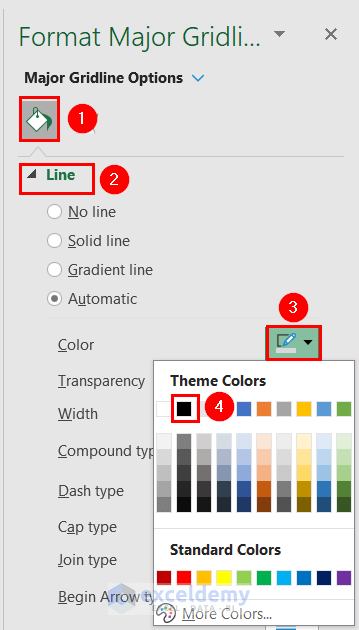
In the Format Major Gridlines dialog box:
- In Fill & Line >> select Line.
- Click Color to select a color. Here, Black.
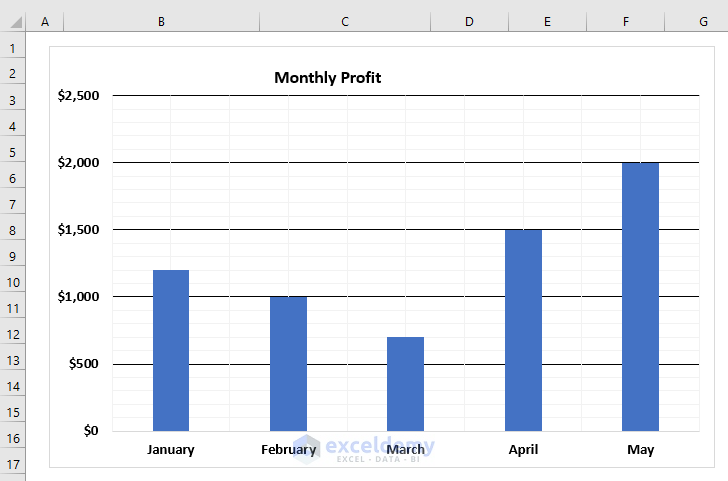
This is the output.
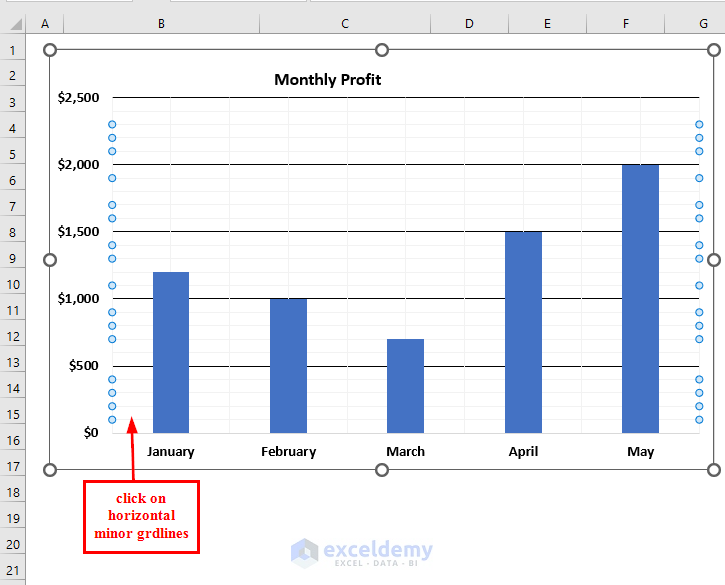
To color the minor horizontal gridlines:
- Click one of the minor horizontal gridlines, and all minor horizontal gridlines will be selected.
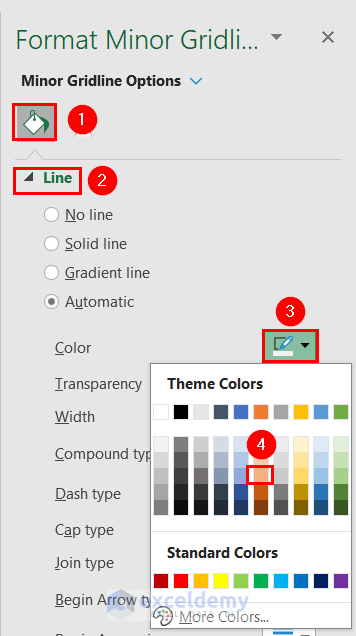
In the Format Minor Gridlines dialog box:
- In Fill & Line >> select Line.
- Click Color to select a color. Here, Orange, Accent 2, and Lighter 40%.
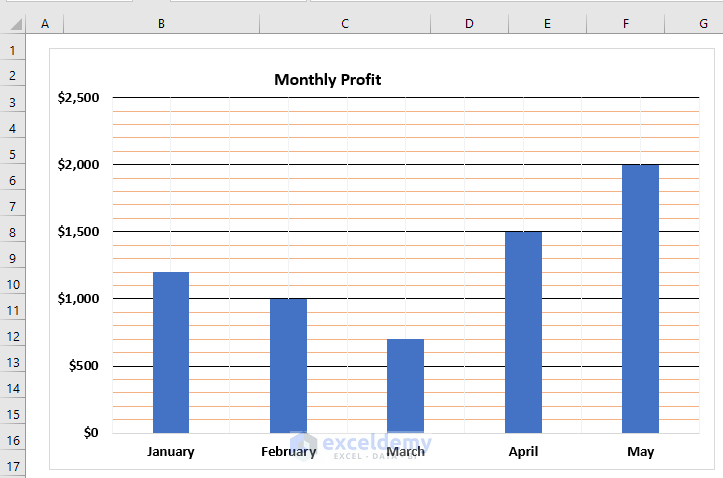
This is the output.
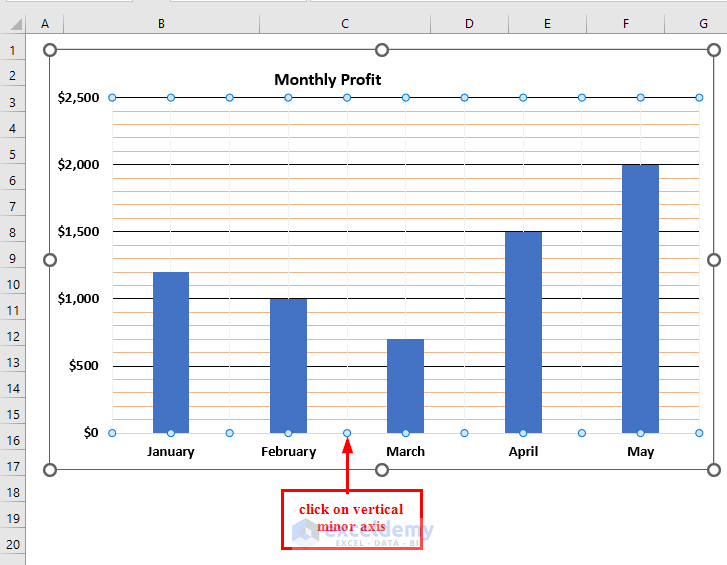
To color the minor vertical gridlines:
- Click one of the minor vertical gridlines, and all minor vertical gridlines will be selected.
In the Format Minor Gridlines dialog box:
- In Fill & Line >> select Line.
- Click Color to select a color. Here, Light Green.
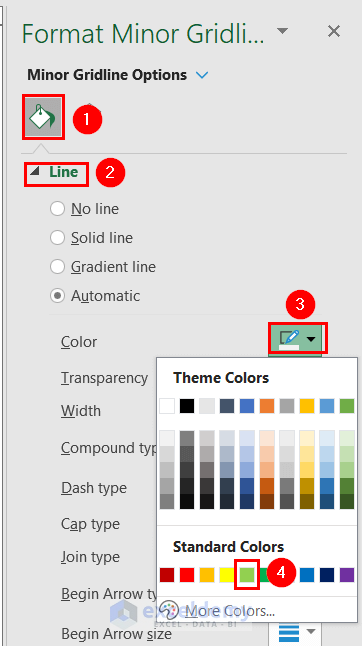
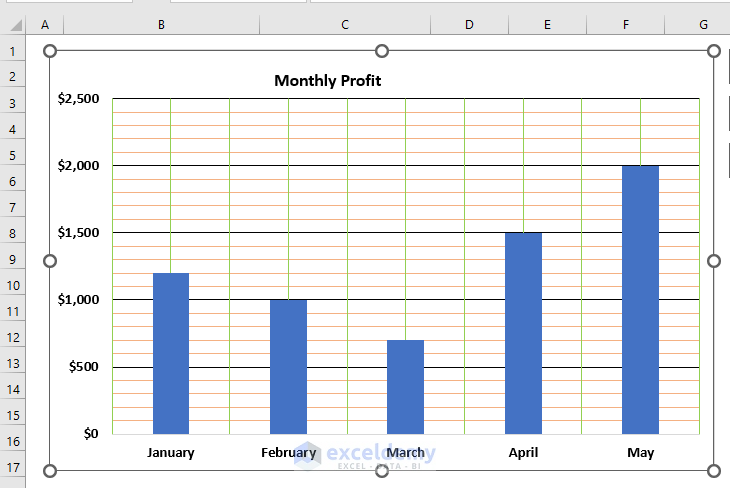
This is the output.
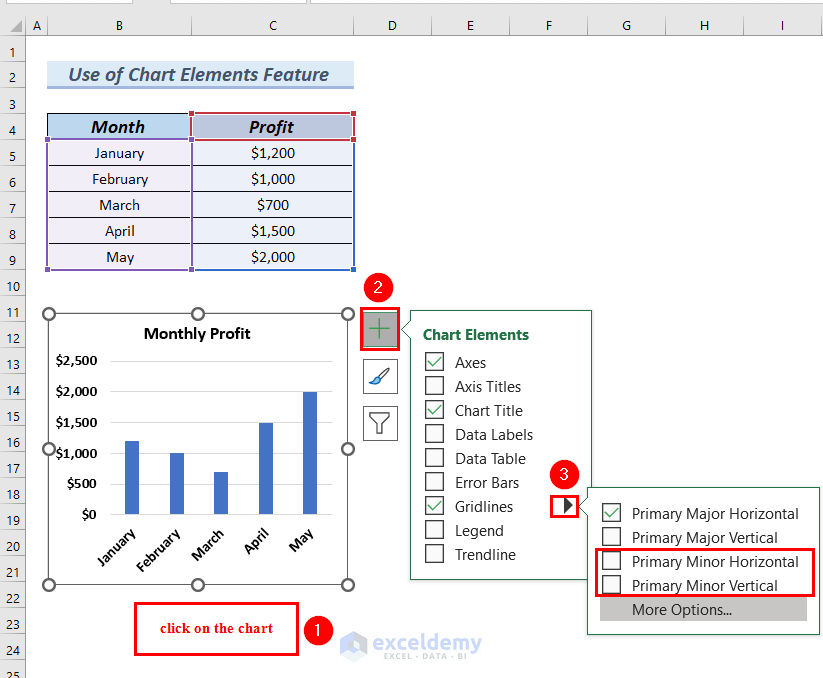
Method 2 – Using the Chart Elements Feature
- Click the chart >> select Chart Elements.
- Click the rightward arrow in Gridlines.
Primary Minor Horizontal and Primary Minor Vertical are unchecked.
- Check both Primary Minor Horizontal and Primary Minor Vertical.
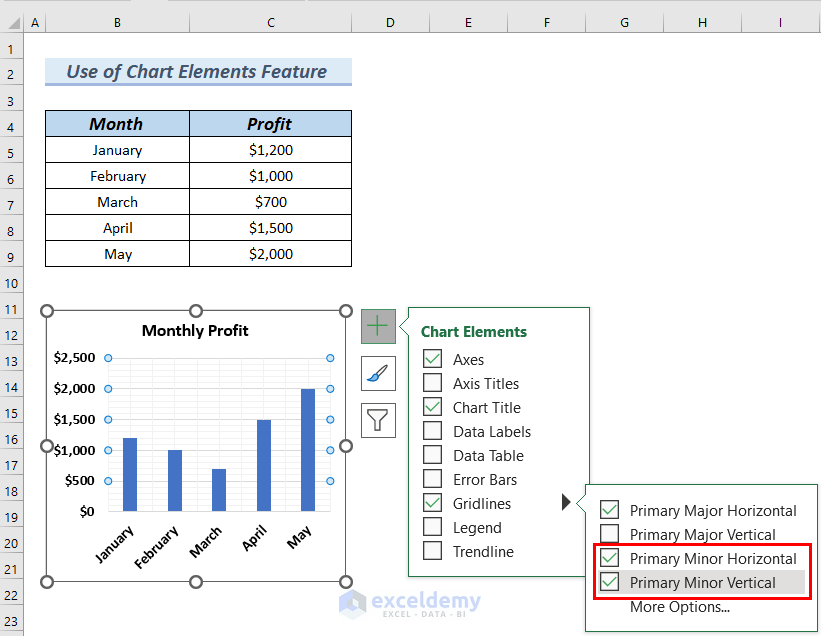
The chart has more gridlines:
To format the gridlines:
- Follow Step 2 in Method 1.
This is the output.
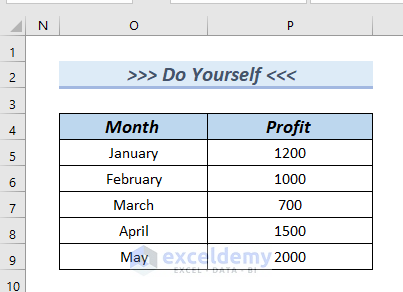
Practice Section
Practice here.
Download Practice Workbook
Download the Excel file and practice.
Related Article
<< Go Back to Add Gridlines | Gridlines | Learn Excel
Get FREE Advanced Excel Exercises with Solutions!
