In this article, we will provide an overview of some of the basic terminology used in Microsoft Excel, including explanations of basic concepts, and common terms used in editing, automation, pivot tables and charts.
Section A – Basic Concepts in Excel
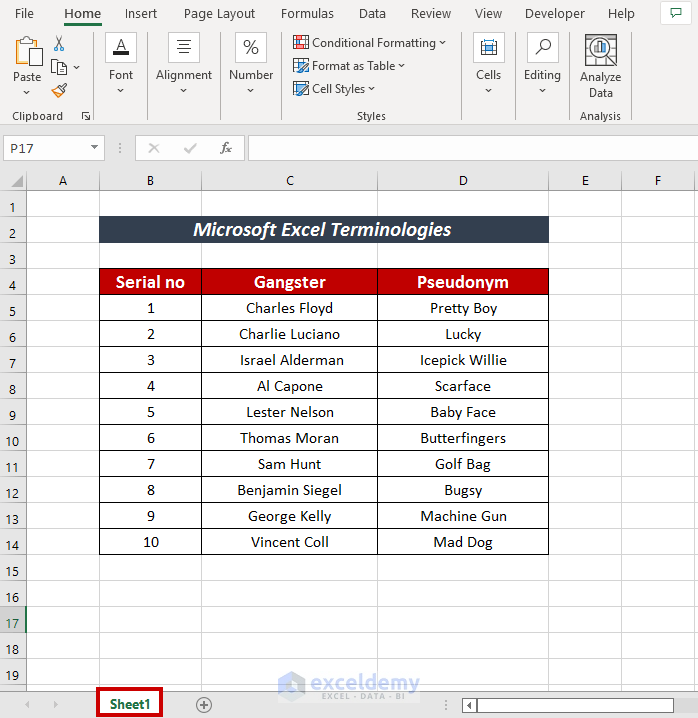
1 – Workbook
A workbook is a file that includes one or more Worksheets. A new workbook can be created from another blank workbook or a template. Simply go to the Blank Workbook option from the File tab on the Ribbon, or just press CTRL + N.
2 – Worksheet
A Worksheet, also called a spreadsheet, is a collection of cells in which you can enter and calculate data. Cells are arranged into columns and rows in a worksheet. Multiple worksheets can be arranged and stored in a Workbook.
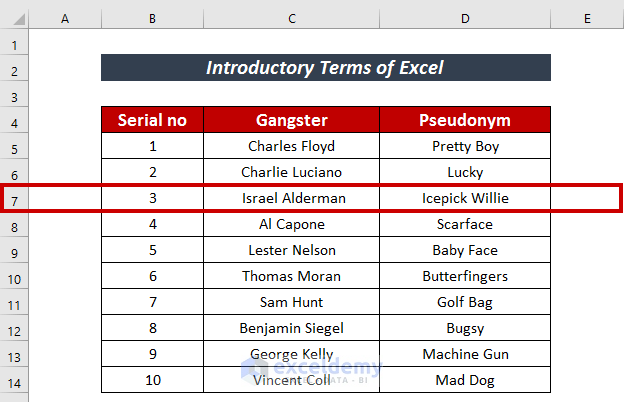
3 – Row
The group of all the cells that run horizontally in an Excel sheet is called a Row. The numbering on the left side of a worksheet denotes the row numbers. In the following picture, The highlighted area signifies row 7.
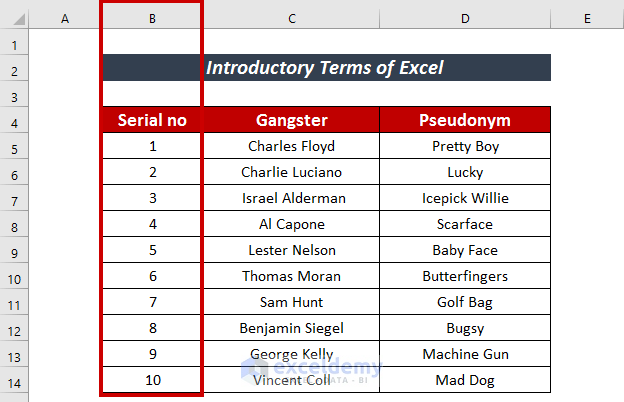
4 – Column
The grouping of cells that run vertically in an Excel sheet is called a Column. The alphabetic numbering that can be seen at the top of the sheet denotes the column numbers. In the image below, B denotes the column that is highlighted.
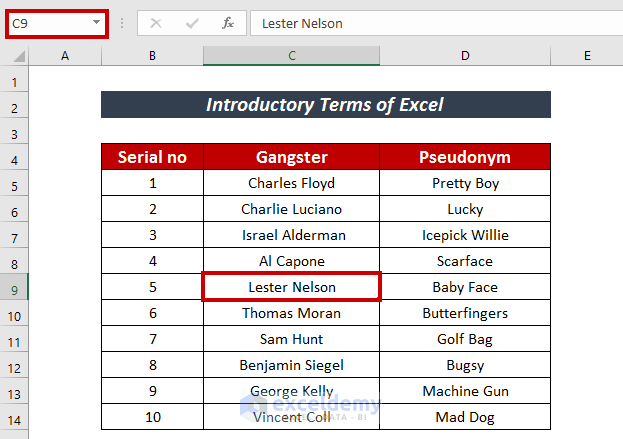
5 – Cell
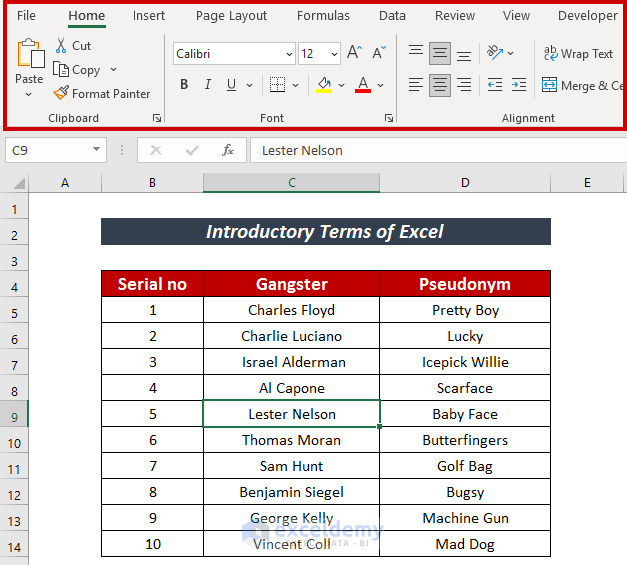
The boxes that are seen in a worksheet within the horizontal and vertical gridlines are called Cells. The cell name is a combination of the row and column numbers where it is located. In the image below, the highlighted cell is denoted with the name C9, meaning it is located at the intersection of column 9 and row C.
6 – Ribbon
The Ribbon is the area where tabs and icons are arranged in rows in the upper portion of the worksheet. It is like a complex toolbar. Click commands on the ribbon to perform the specified operations those commands represent. The highlighted area shows the location of the ribbon in Excel.
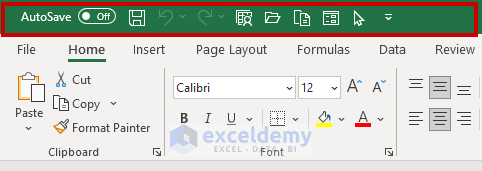
7 – Quick Access Toolbar
In Excel, the command bar that appears above or below the primary ribbon tabs is called the Quick Access Toolbar. It provides constant visibility and easy access to a set of preferred commands.
8 – Function
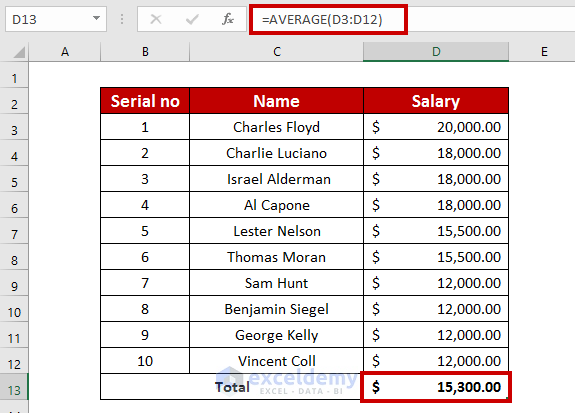
Functions are built-in formulas to perform various calculations in Excel. In order to perform a function properly, you need to input the required arguments for the function in the specified order.
For example, the formula =AVERAGE(D3:D12) returns the average value of the cells from D3 to D12. After inputting the equal sign and writing AVERAGE as a function, the cells whose values should be averaged need to be defined. If arguments are not entered in the correct order, the intended result will not be returned.
9 – Formula
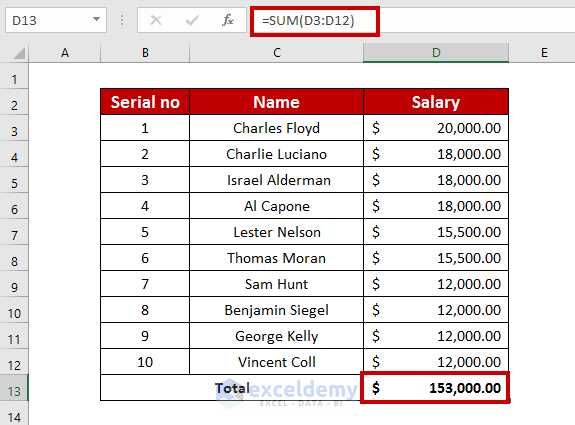
A Formula in Excel is simply an equation. We use formulas to perform calculations, manipulate cell data, check if data meets conditions, and so on.
For example, here we use the =SUM(D3:D12)formula to calculate the sum of cells D3:D12.
10 – Formula Bar
The Formula Bar is an input box situated on top of the worksheet, as shown in the image below. It shows the formula in the current cell and allows editing of this formula.
11 – Array
An Array is a set of elements, in Excel usually cells. The elements may take the form of text or numbers and may be placed in a single row, a single column, or numerous rows and columns.
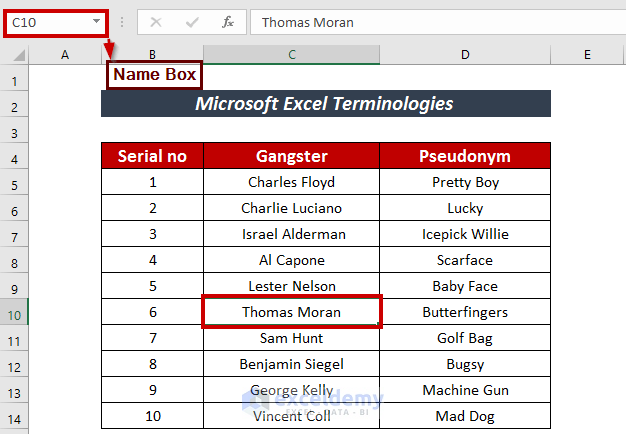
12 – Name Box
The small box next to the formula bar is called the Name Box. It displays the name of the selected cell if a name has been defined for it. You can also define a name for the selected cell in the Name Box.
Section B – Excel Editing Terms
Excel offers many features with respect to editing. We’ll cover some of the most important and commonly used terminology here.
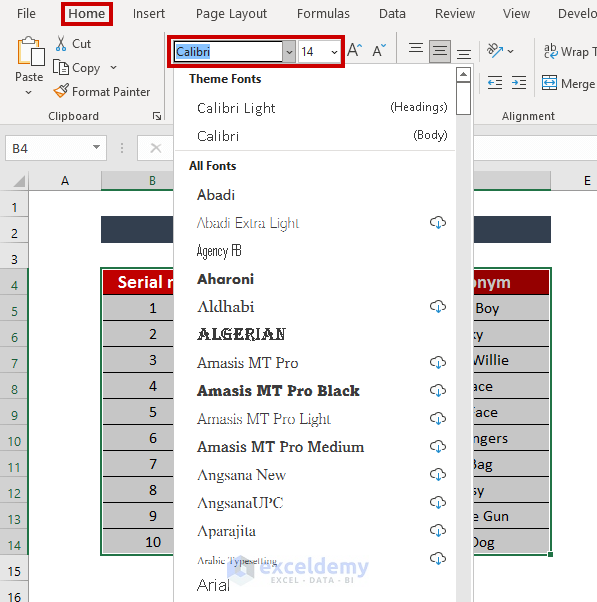
1 – Font
The term Font basically describes a collection of text or typographic characters that can be printed or displayed in a certain size and style. Excel uses Calibri font style in size 11 as default, but there are many other options. From the Home tab, you can select a preferred font style and font size as desired.
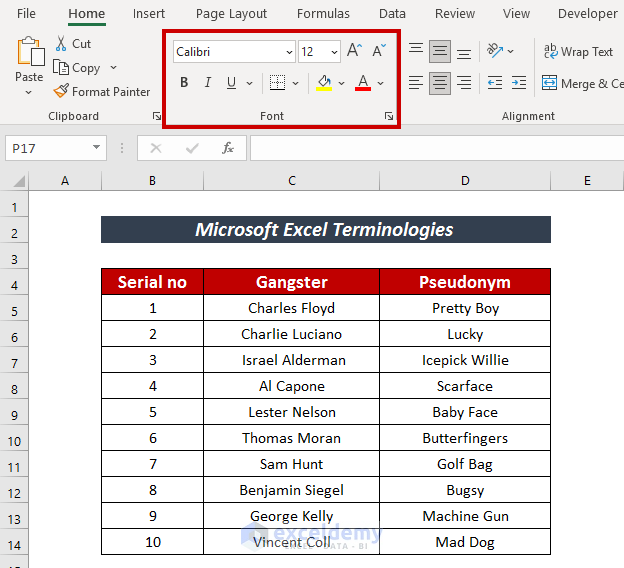
2 – Cell Formatting
Cell Formatting means changing the style and look of cells without changing the actual cell values. We can modify the number, alignment, font style, border style, fill options, and protection with the aid of cell formatting. Right-clicking the mouse on cells that have been selected will open a Context Menu offering various cell formatting options.
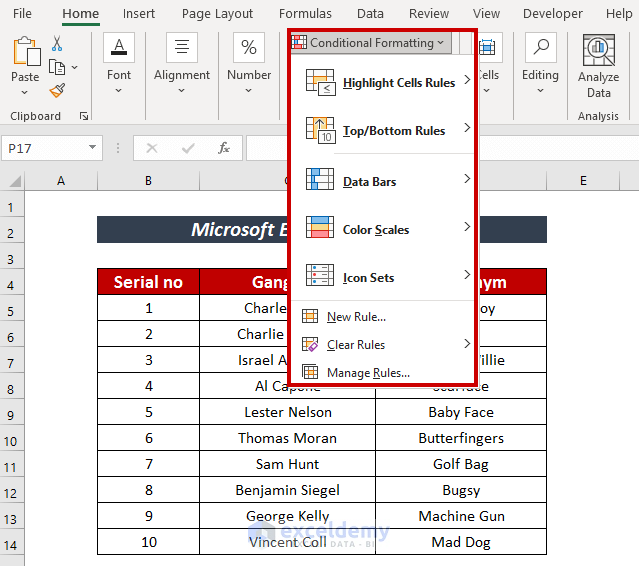
3 – Conditional Formatting
Conditional Formatting is an Excel feature used to highlight certain values or make specific cells clearly observable based on specified conditions. If cells meet the conditions, their appearance will be modified as specified.
4 – Freeze Panes
You can freeze certain columns and/or rows in a worksheet by using the Excel Freeze Panes option. The frozen cells won’t move when you scroll down or across a worksheet.
In the following image, we’ve used the Freeze Panes option to freeze the top 4 rows and column A. If we scroll down or to the right, these cells will remain in place while the rest of the data scrolls.
5 – Merged Cells
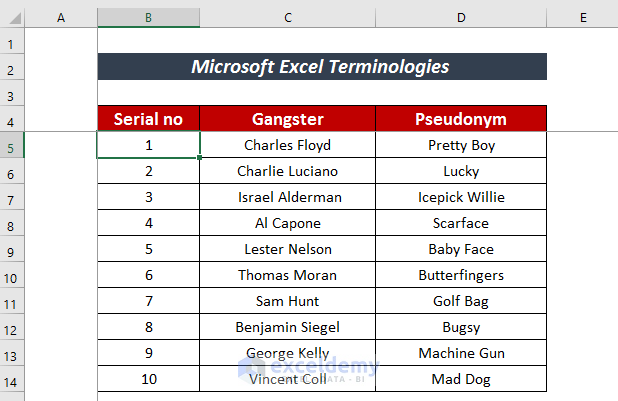
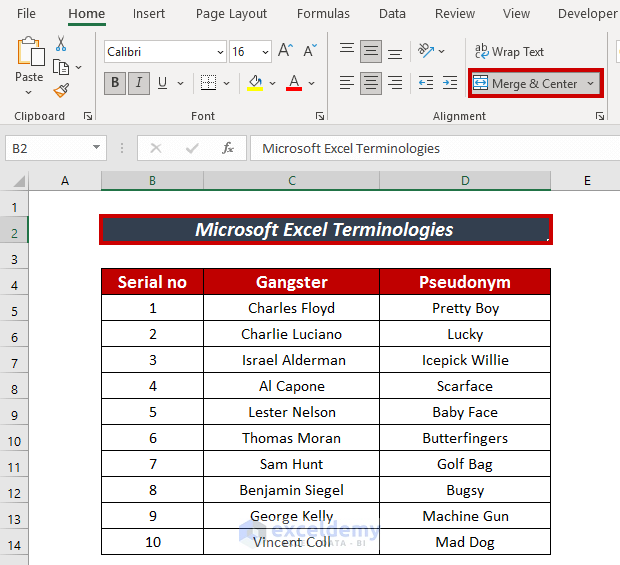
In Excel, Merged cells are cells that have been joined together into a single cell. This is useful for creating a single cell that spans multiple columns or rows. To merge cells in Excel, select the cells that you want to merge, then click on the Merge & Center option on the ribbon under the Home tab.
In the example below, we used the Merge & Centre command to merge cells B2, C2 and D2.
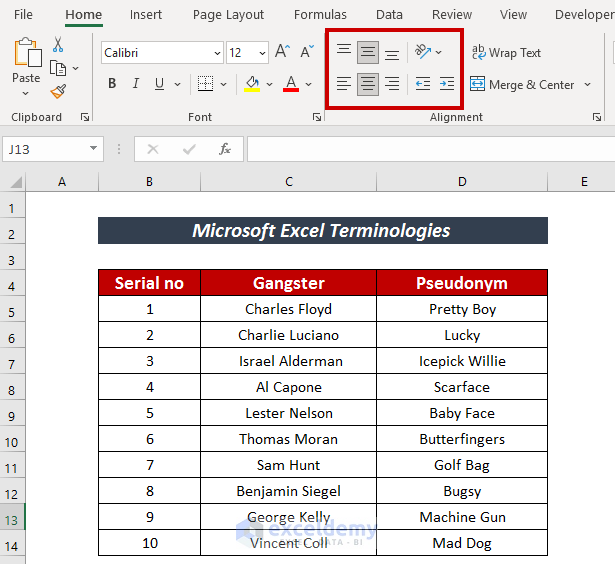
6 – Alignment
In Excel, Alignment refers to how cell contents are positioned within a cell. Cell contents can be aligned in horizontal and/or vertical manner. Horizontal alignment can place values to the left, center or right positions in a cell. Vertical alignment can be in the top, middle, or bottom positions.
Section C – Basic Excel Automation Terms
There are some very efficient features to reduce workloads via automating repetitive tasks.
1 – AutoFill
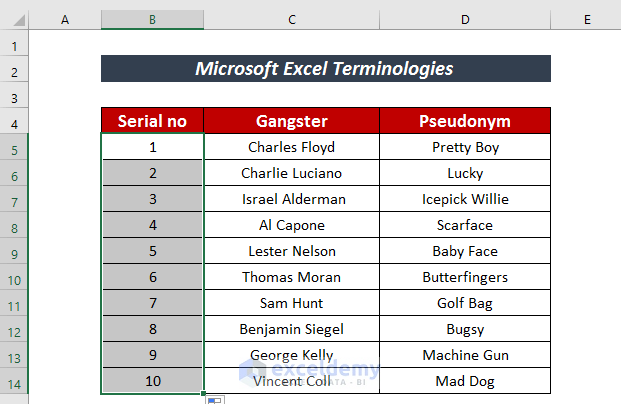
AutoFill is a feature in Excel that allows you to quickly fill in a series of cells with a pattern or data. After selecting a cell, hovering the mouse over the right bottom corner of the cell reveals a ‘+‘ shaped icon called the Fill Handle. Dragging the Fill Handle (either up, down, left or right) over other cells will copy the formula or data in the selected cell into the cells dragged over by the Fill Handle.
In the example below, we input the values 1 and 2 in the first two cells of the Serial Number column, then dragged the Fill Handle down to fill the cells below with the same series of numbers.
2 – AutoSum
AutoSum is a feature in Excel that allows you to quickly sum up a range of cells. To use AutoSum, select the cell below the range of cells you want to sum, then click the AutoSum button on the Home tab. Excel will automatically sum the range of cells and insert the result in the selected cell.
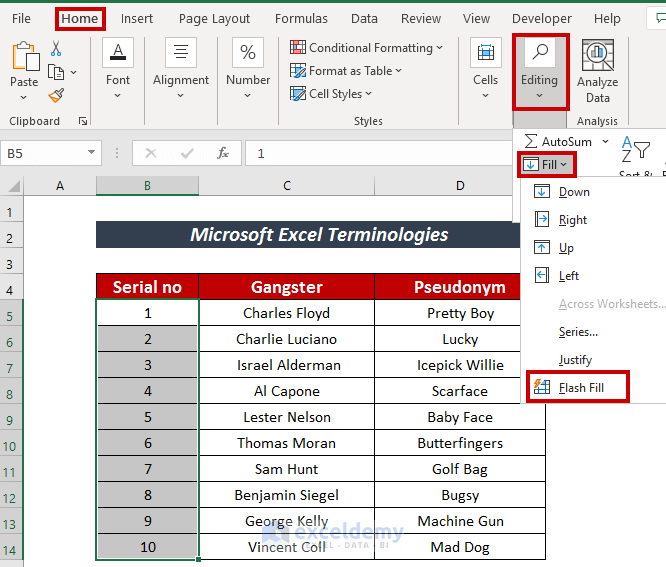
3 – Flash Fill
Flash Fill is a feature in Microsoft Excel that allows you to quickly fill in a column of data based on another column of data. For example, here we used the Flash Fill feature to fill numbers in the Serial No column serially.
Section D – Pivot Table Terms
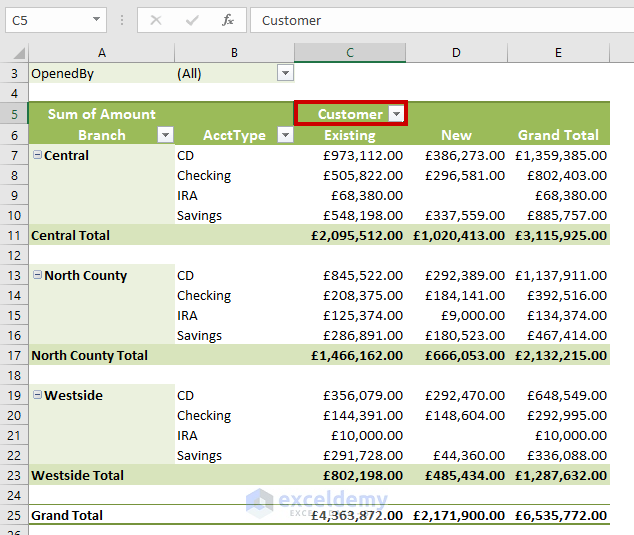
1 – Column Labels
Column Labels in an Excel pivot table control the way that data is displayed in the columns of the pivot table. By default, each column label will show the value of the data in that column. However, you can change the way that the data is displayed by changing the column label settings.
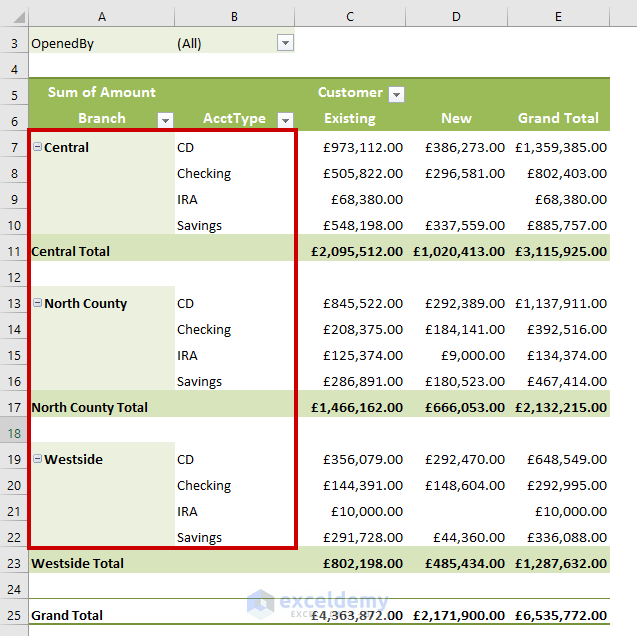
2 – Group
A Group is a collection of items in a pivot table that have the same value for a given field.
3 – Item
Item is a label that describes the data in a cell. Items can be numeric values, text, or dates.
4 – Refresh
Refresh in an Excel pivot chart refers to the process of updating the chart with new data from the underlying pivot table. This feature is useful when the pivot table has been updated with new data, or if the structure of the pivot table has been changed.
5 – Row Labels
Row Labels are the labels that appear on the X-axis of an Excel pivot chart. These labels can be used to identify the data points in the chart.
6 – Source Data
Source data is the data that is used to create a pivot table. Source data can be located in a worksheet or an external database.
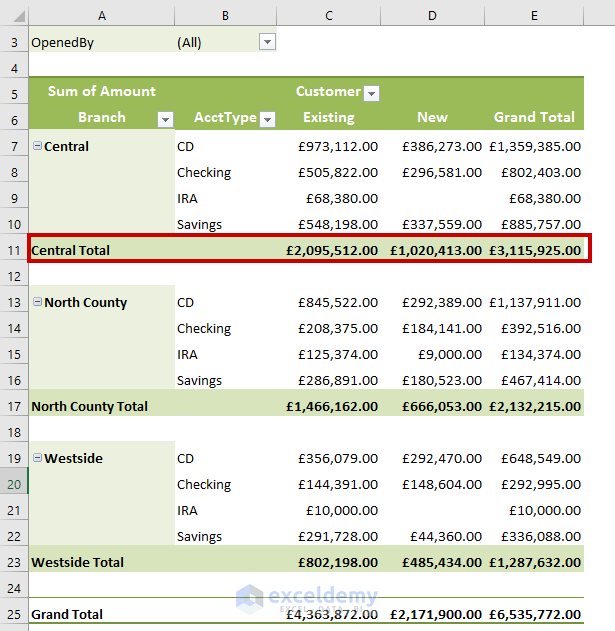
7 – Subtotals
The Subtotals feature allows you to quickly and easily view summary data for your pivot table. To add subtotals to your pivot table, simply click on the pivot table and then click on the Subtotals button in the PivotTable Tools tab. You will then be able to choose for which columns you want to add subtotals, and whether to show or hide the subtotals.
8 – Table Filter
Table Filters are used to filter the data in a Pivot table. This can be done by selecting the data that you want to filter and then clicking on the Filter button in the Table Tools tab.
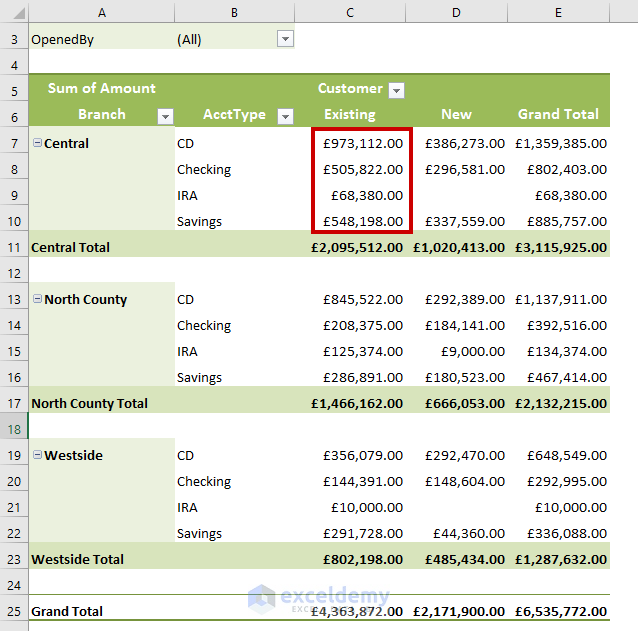
9 – Values Area
The Values Area refers to the cells in a pivot table that contain the summary data. Excel offers many ways to summarize the data (sum, average, count, and so on). In order to create a Values Area, right-click on any value in the pivot table and then use the Summarize Values By option.
Read More: Excel Basics for Beginner Excel Users
Section E – Basic Excel Diagram Terms
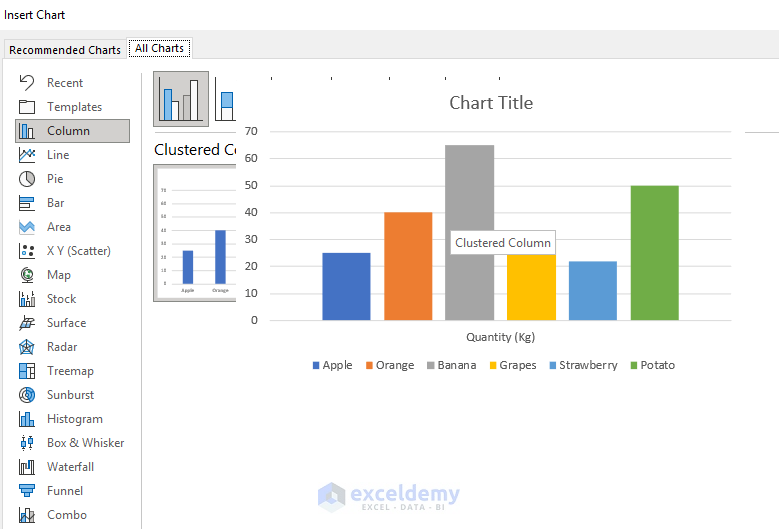
1 – Column Chart
A Column Chart is a graphical representation of data that uses vertical bars to indicate different values. To create a column chart in Excel, a data set that contains multiple columns is required. Each column represents a different category, and the height of the bar indicates the value for that category.
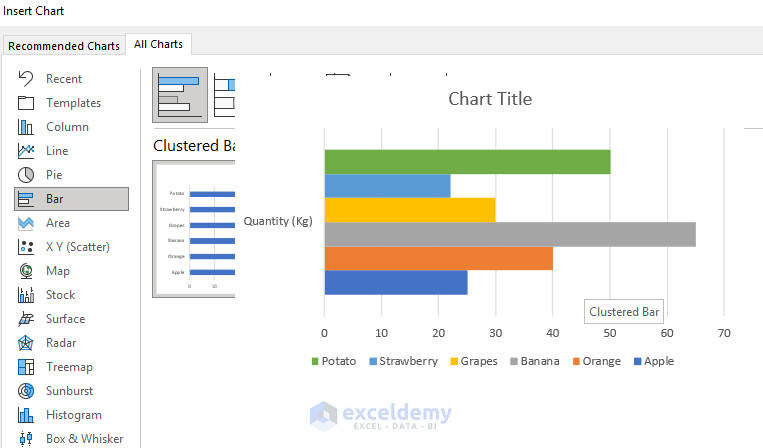
2 – Bar Chart
A Bar Chart in Excel is a graphical representation of data that uses rectangular bars to compare values across categories. Bar charts are a useful way to compare data that is grouped into categories, such as data about different types of products, regions, or customers.
3 – Stacked Chart
A Stacked Chart is a graph that shows the relative proportions of multiple series of data. Each series is represented by a colored bar, and the total height of the bar represents the combined total of all the data for all the series at that point.
Read More: Advanced Excel Topics
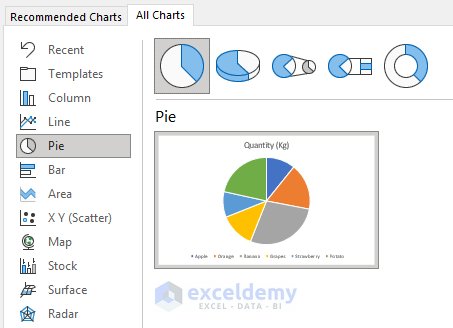
4 – Pie Chart
A Pie Chart is a graph that shows how much each category contributes to a total. It looks like a circle that has been sliced into sectors. The size of each sector represents the proportion of the total that each category represents.
Read More: 22 Limitations of Excel That Might Frustrate You
Get FREE Advanced Excel Exercises with Solutions!


Really, The website from which you interpreting things about excel is excellent !!
Thanks Buddy for your contribution on this.
Shivaji,
It is my achievement when a person says me that I helped him/her in some way. Thanks. Keep in touch.
Could you please send me the resources for Excel VBA and ACCESS VBA Including books
Shivaji,
Right now I have no book on Microsoft Access. But just subscribe my Email list using the below link, you will get two books on Excel: 1200+ Macro Examples E-Book, 220+ Excel Keyboard Shortcuts E-Book and other Excel resources.
http://www.eepurl.com/bqFItv
Thanks, Kawser. Handy guide, even an old grizzled Lotus & Symphony fan learned a trick or two. Carl
Dear Carl,
Thanks for your appreciation. ExcelDemy is glad to help you.
Regards
Shamima Sultana | Project Manager | ExcelDemy