There is only one slope for a linear graph. But in the case of an exponential graph, there are many slopes that we can detect. This article is about how you can calculate the slope of an exponential graph in Excel.
Basics of Slope and Exponential Graph
Exponential Graph:
Exponential graphs increase or decrease rapidly. The basic equation for the exponential graph is:
y=a.bxIn this formula, a, and b are constants.
Slope:
The slope indicates whether there is an upward trend or a downward trend. It defines the steepness.
For this exponential equation, let’s find out its slope.
lny = lna + x(lnb)
Slope: dy/dx=a.bx(lnb)
How to Calculate Slope of Exponential Graph in Excel: 3 Simple Steps
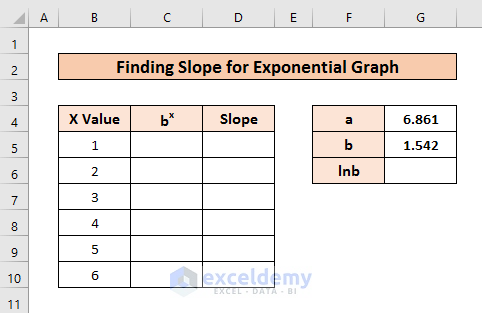
We have taken a dataset of X values and Y values where the Y values increase exponentially with the X values.
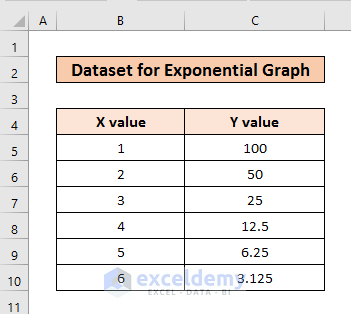
We will convert this dataset into an exponential function. With the help of the LOGEST function we will find the constant values a and b. Then, we will find slopes for every X value.
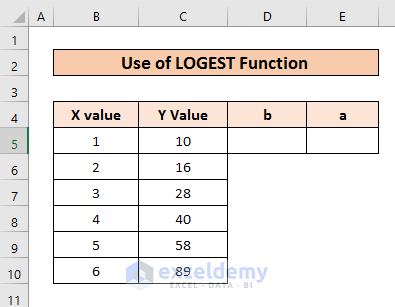
Step 1: Finding Constant a and b of Exponential Graph with LOGEST
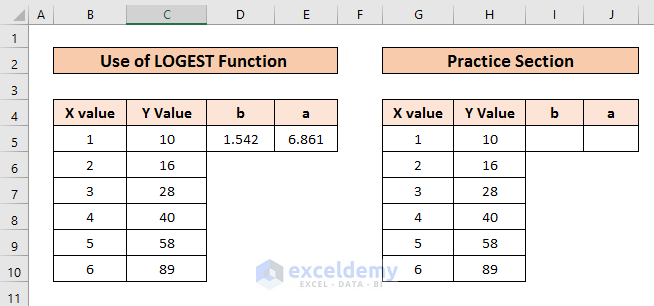
First, we have to find the value of constants a and b.
➤ For that, add two columns beside the dataset.
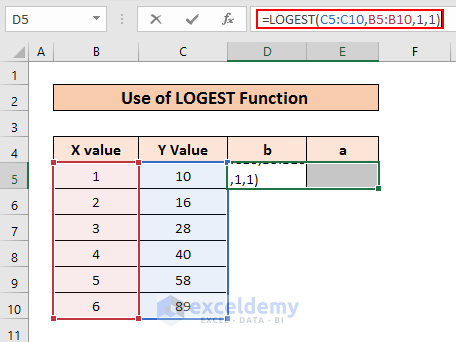
➤ Select both cells D5 and E5.
➤ Then, write the following formula and press ENTER.
=LOGEST(C5:C10,B5:B10,1,1)Here,
- C5:C10:- Y values
- B5:B10:- X values
- 1 :- const value
- 1:- Stats value
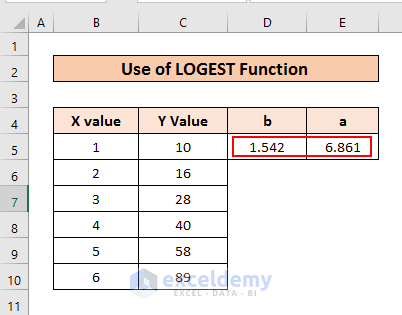
Thus, we get the constant values a and b.
Read More: How to Calculate Slope and Intercept in Excel
Step 2: Calculating Slope of Exponential Graph in Excel
As we have shown previously, the slope for the exponential equation is:
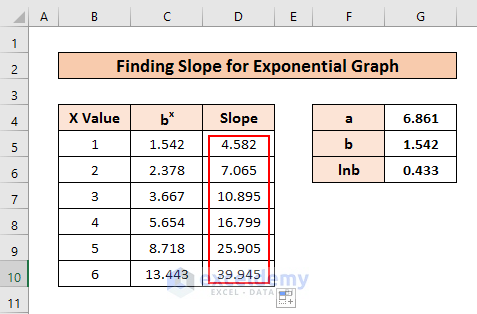
dy/dx=a.bx(lnb)We have already got a and b. Now, we will find bx and lnb and calculate corresponding slopes for X values.
➤ Apply the LN function in cell G6 and press ENTER.
=LN(G5)This function gives a Logarithm for a value.
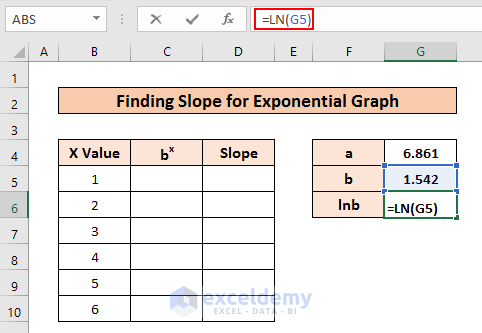
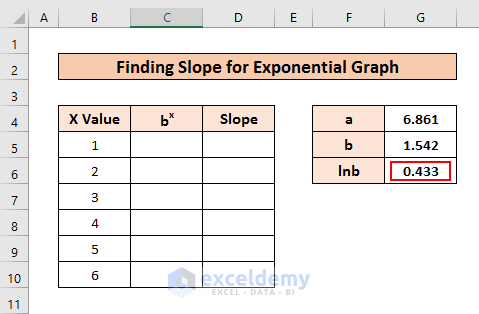
So, we get the value of lnb.
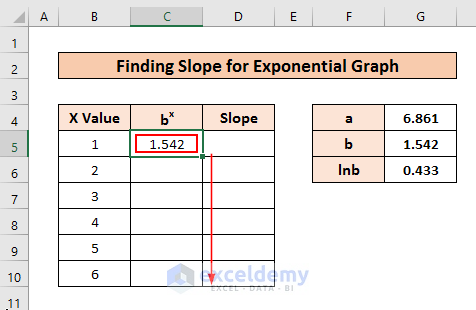
➤ Now, apply the POWER function in C5 and press ENTER.
=POWER($G$5,B5)Here,
- $G$5:- absolute value
- B5:- X values
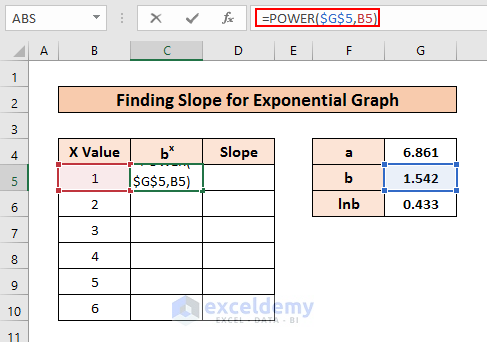
Thereby, we get value for bx.
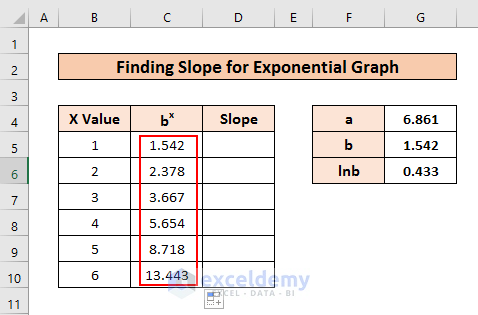
➤ Now, Hold and Drag the C5 cell downward.
So, we get bx values for all the cells.
➤ Now, write the following slope formula D5 and press ENTER.
=$G$4*C5*$G$6Here,
- $G$4:- absolute value
- C5:- bx
- $G$6:- absolute value
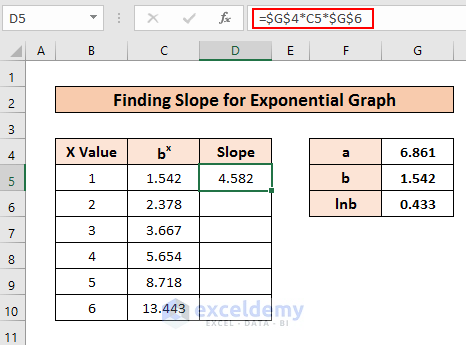
Doing so, we get the first slope value.
➤ Now, Hold and Drag the D5 cell Downward.
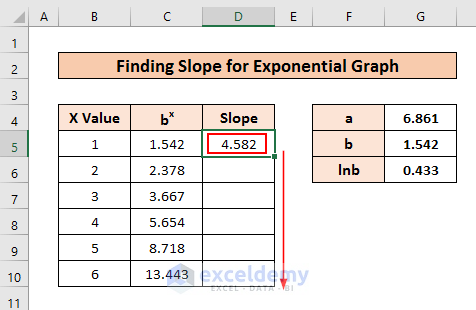
Thus, we have all the slope values.
Read More: How to Find the Slope of a Line in Excel
Step 3: Plotting Graph of Slope Value vs X Values
Now let’s plot slope values vs x values graph.
➤ First, copy and paste the X Value and Slope Columns in a new sheet.
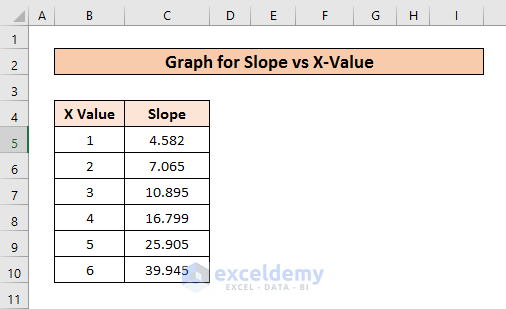
➤ Now, select all the data from these two cells.
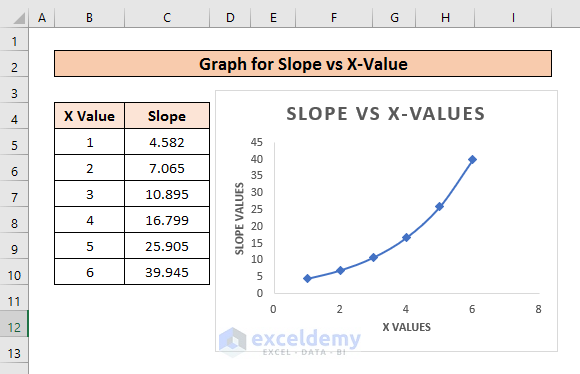
➤ Then go to the Insert ribbon and select any format from the Charts section.

So, a graph will appear in the sheet containing slope values and x values.
Read More: How to Find Instantaneous Slope on Excel
Practice Section
You can download the practice workbook from the download section and practice yourself.
Download Practice Workbook
Conclusion
So, we have shown you how to calculate the slope of the exponential function in Excel. We hope you found the content of this article useful. If you have further queries or suggestions regarding this procedure please leave them in the comment section.
Related Articles
- How to Find Slope of Tangent Line in Excel
- How to Find the Slope of a Regression Line in Excel
- How to Find Slope of Logarithmic Graph in Excel
<< Go Back to Excel SLOPE Function | Excel Functions | Learn Excel
Get FREE Advanced Excel Exercises with Solutions!
