The article shows how to perform one and two-variable sensitivity analysis in Excel. Sensitivity analysis studies how different sources of uncertainty can affect the final output in a mathematical model. Fortunately, we can do one and two-variable sensitivity analysis in Excel by using some simple formulas. Please stay tuned for the rest of the article to get to the topic.
One and Two Variables Sensitivity Analysis in Excel: 2 Examples
Recently one of my friends borrowed money from a bank to buy a house. I was asked to determine how monthly payments will vary as the total amount borrowed or term length changes.
At that time, What-if Analysis in Excel came to my mind to quickly try out different values for formulas.
Here are the details about the mortgage. My friend planned to borrow $200,000 and the interest rate is 3.40%. The mortgage term is 30 years which means 360 months.
To start off, I only applied a one-way data table to see how the changes in mortgage amount will affect the mortgage payment. The Excel file applied just looks like below.
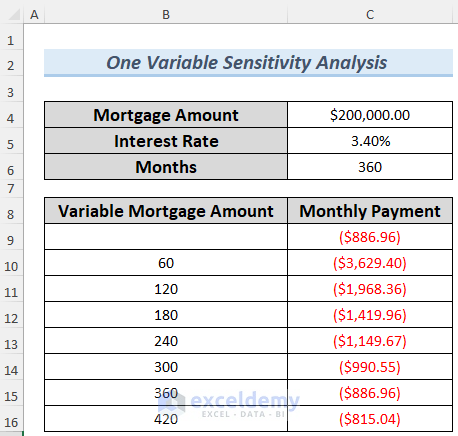
I have all the necessary inputs – mortgage amount, interest rate, and months – in section 1 and the data table in section 2.
Initially, I used the following formula in cell C7, and you can see that my friend needs to pay $886.96 every month. Then a range of mortgage amounts was put down in column B from cell B8 (shown below).
=PMT(C5/12,C6,C4)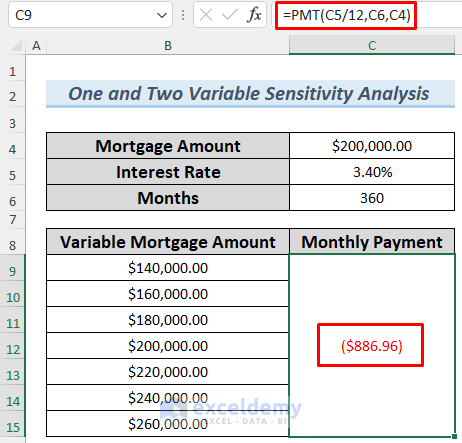
1. Example of One-Way Variable Sensitivity Analysis in Excel
We need to rearrange the data first to do the one-way variable sensitivity analysis. Let’s go through the following sections for further discussion.
Steps:
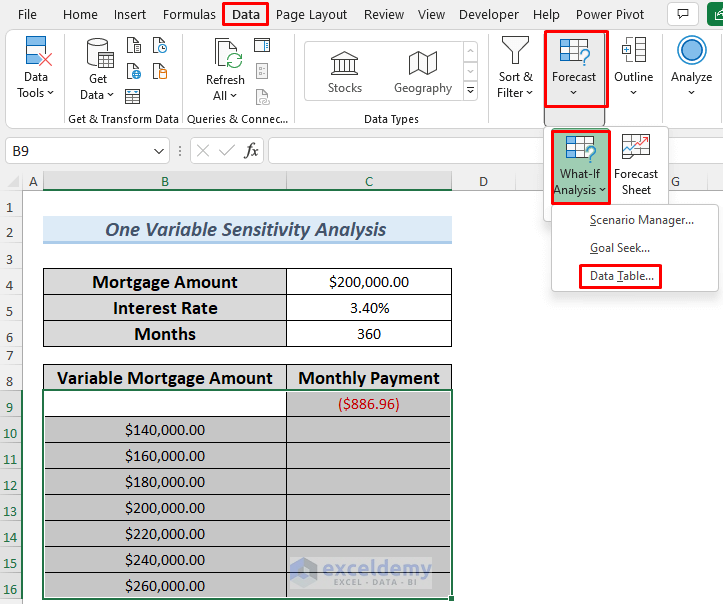
- First, I selected the table ranges (cells B9:C16 in this case) which begin one row above the first input value (row 9) and the last row is the row containing the last input value (row 16).
- The first column in the range is the column containing inputs (column B) and the last column is the column including outputs (column C).
- Then click the Data tab on the ribbon, choose What-If Analysis, and then click on Data Table.
- A Data Table dialog box is prompted after clicking on Data Table. Since our table is column-oriented, I just put the column input cell reference $C$4 and leave the row input cell blank.
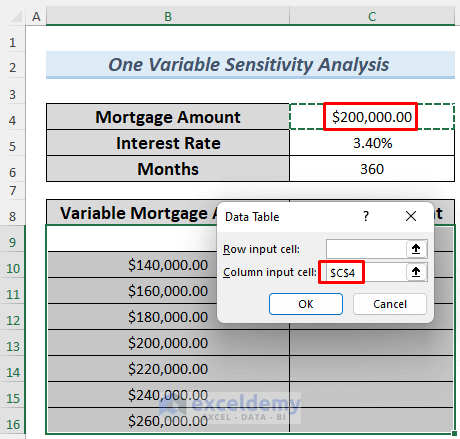
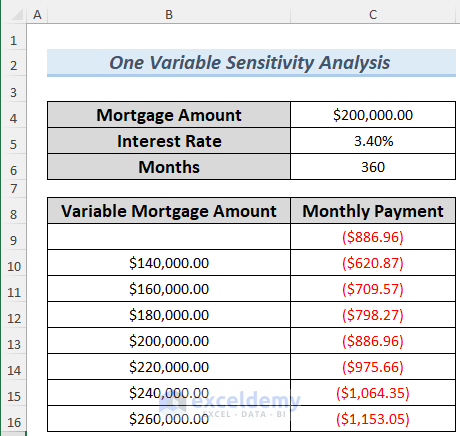
- By clicking OK, I got the below results.
- When the mortgage amount decreases from $200,000 to $140,000, the monthly payment will decrease from $886.96 to $620.87. And for the other variable mortgages, we see the monthly payment also.
- I also made a one-way data table to see the impact of changes in terms of the months. You can see that my friend needs to pay about $1,419 every month if she plans to pay off in 15 years.
2. Example of Two Way Variable Sensitivity Analysis in Excel
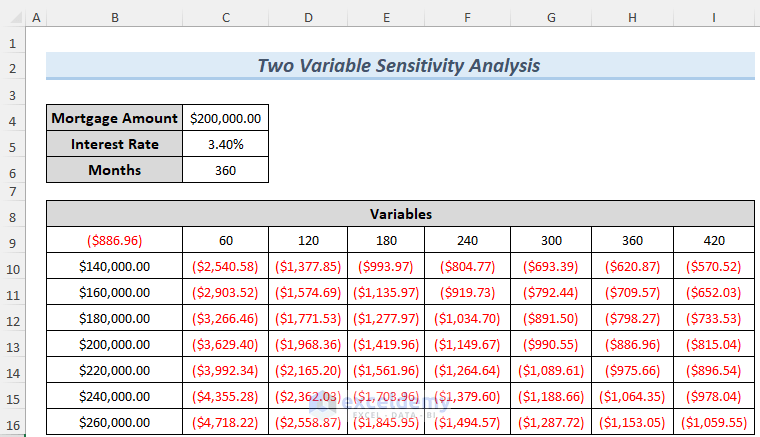
We also would like to know how monthly payment varies as total mortgage varies from $140,000 to $260,000 (in $20,000 increments) and term length varies from 5 years to 35 years (in 5-year increments).
Steps:
- First, we changed two inputs, and therefore we created the two-way data table.
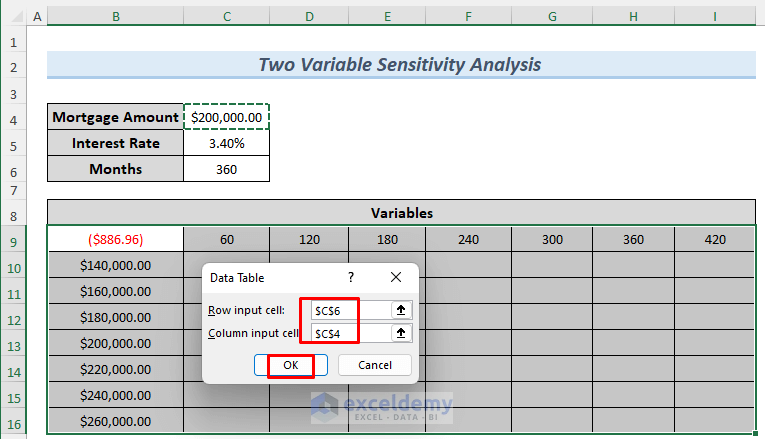
- We put the mortgage amount values down the first column (column B) of the table range and term length values in the 7th row.
There is one point that I have to remind you. A two-way data table can have only one output cell, and you must place the formula for the output in the upper-left corner (B9 in this case) of the table range.
As with a one-way table, we selected the table range (range B9:I16) and clicked the Data tab. In the Data Tools group, choose What-If Analysis and then select Data Table. Since there are two sources of uncertainty, I need to fill both rows input cell and column input cell. In our case, cell C4 (mortgage amount) is the column input cell and cell C6 (mortgage term length) is the row input cell.
- In the Data Table dialog box, we put the cell reference $C$6 in the Row input cell section and $C$4 in the Column input cell section.
- After clicking OK, you see the two-way data table shown as follows. As an example, in cell C8, when the mortgage amount is $140,000 and the term length is 5 years or 60 months, the monthly payment equals $2,540.58.
Things to Remember
Finally, I have several notes for you:
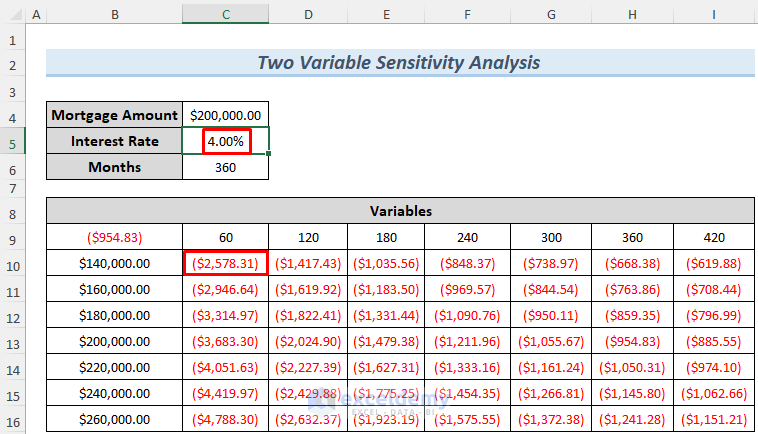
- First, as you change input values in a worksheet, the values calculated by a data table change too. For example, if you increase the interest rate from 3.40% to 4.00%, the monthly payment will be $2578 (number in a blue square) given a 5-year $120,000 mortgage. When comparing with the above figure, you can see from the below screenshot that all values in this two-variable data table have been changed.
- Next, you cannot delete or edit a portion of a data table. If you select a cell in the data table range and edit accidentally, the Excel file will prompt a warning message and you can’t save, change, or even close the file anymore. The only way that you can close it is by ending the task from task management. It causes time waste if you did not save the file before making that mistake.
- Though the column-oriented one-way table (which is also applied in this post) is used popularly, you can also make your own row-oriented one-way table by yourself. Just put inputs in one row and only fill the row input cell reference in the Data Table dialogue box.
- After that, when making a two-way data table, do not mix up your row input cell and column input cell. This kind of mistake can result in big errors and nonsensical results.
- In addition, Excel enables the automatic calculation by default and that’s the reason why any change in the inputs can cause all data in the data table to recalculate. This is a fantastic feature. However, sometimes, we’d like to disable this feature especially when the data tables are large and automatic recalculation is extremely slow. In this situation, how can you disable automatic calculation? Just click the File tab on the ribbon, choose Options, and then click the Formulas tab, and select Automatic Except For Data Tables. Now you can recalculate all your data in the data table only when you press the F9 (recalculation) key.
Download Practice Workbook
Conclusion
After reading the description above, we can consider that you will learn how to analyze one and two-variable sensitivity analysis in Excel. If you have any better suggestions or feedback, please leave them in the comment section.
Related Articles
- How to Create a Sensitivity Table in Excel
- Data Table Not Working in Excel
- [Fixed] Excel Data Table Input Cell Reference Is Not Valid
<< Go Back to Data Table in Excel | What-If Analysis in Excel | Learn Excel
Get FREE Advanced Excel Exercises with Solutions!
