How to Do What-If Analysis Using Scenario Manager in ExcelIn this article, we’ll learn five quick and suitable steps on how to use scenario manager in Excel.
We have used the Microsoft 365 version to prepare the workbook for this article. However, it is applicable to all other versions of Excel.
Introduction to Scenario Manager
I have introduced you to how to do sensitivity analysis in Excel using one or two variables data table. It is useful but it only can tell how one or two different sources of uncertainty can affect the final output in a mathematical model. What if we want to vary more than two inputs? Obviously, this can happen in real life. What should we do?
Luckily, Excel provides us with a Scenario Manager to handle this situation. It allows you to vary as many as 32 inputs. To facilitate the management of so many various inputs, Excel provides a name – Scenario – to represent a set of different input values and the corresponding calculated output value. For each scenario, you need to give it a unique name. The scenarios can be saved as part of the workbook. You can switch between scenarios to see how the inputs can affect the final output by double-clicking on any of the scenarios in the Scenario Manager dialogue box. Moreover, with the saved Scenarios, Excel can also create a beautiful summary report containing the various sets of inputs and corresponding final outputs to facilitate review.
Read More: Scenario Analysis in Excel
How to Use Scenario Manager in Excel: 4 Easy Steps
Let’s get introduced to our dataset first. I have Sale Units, Price per Unit, and Variable Cost per Unit on my sheet and I’ll use Scenario Manager in Excel using this dataset.
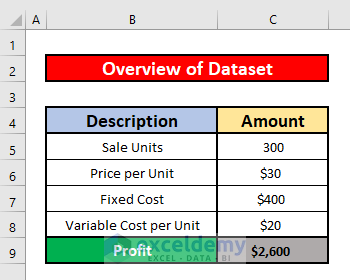
Step 1: Create Dataset with Proper Parameters
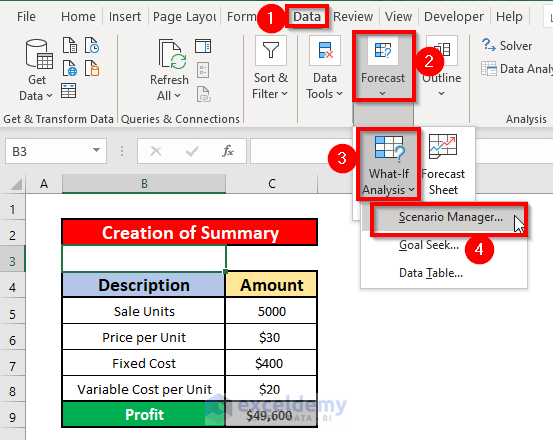
Suppose, that we are going to sell a book and would like to know how the Sale Units, Price per Unit, and Variable Cost per Unit can affect the final profits. The profit is dependent on Sale Units (Cell C2), Price per Unit (Cell C3), and the Variable Cost per Unit (Cell C5). Therefore, type the below formula in cell C9.
=C5*C6-C7-C5*C8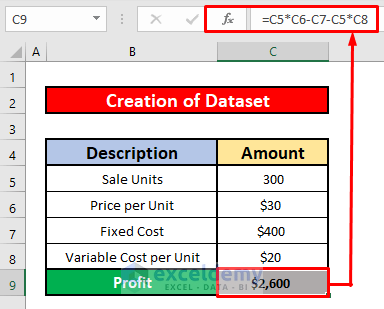
Step 2: Make Scenario Manager
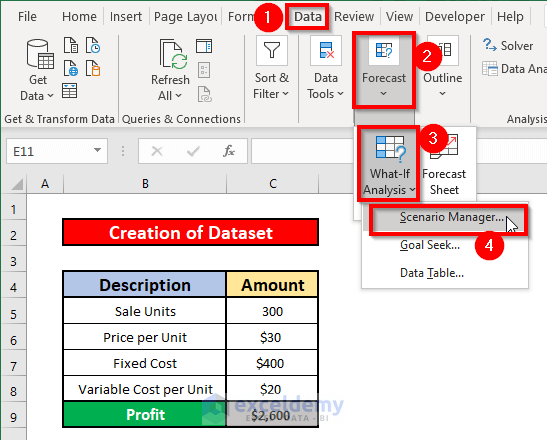
Now if you want to know how to use scenario manager in Excel, let’s set up a Scenario Manager. To do that, follow the instructions below:
- First of all, from your Data tab, go to,
Data → Forecast → What-If Analysis → Scenario Manager
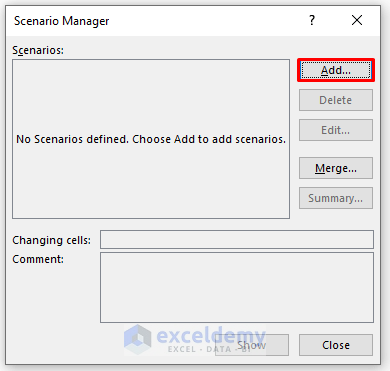
- As a result, a Scenario Manager dialogue box will appear in front of you. From the dialog box, click on Add option.
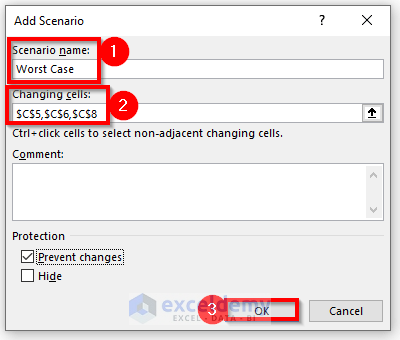
- In the prompted Add Scenario dialogue box, fill in the required details. Enter a name (Worst Case) for the Scenario name Add any comment that you wish to into the Comment box. Or you can also leave it blank. As for the Changing cells, fill in all the reference cells (C2, C3, C5 in this case) that contain the input values. Please note that the references must be separated by commas. Or, just press the CTRL key on your keyboard and select all the cells, one by one, that contain the input values. At last, press the OK option.
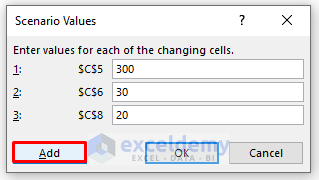
- Hence, the Scenario Values dialogue box pops up. Fill in the Scenario Values dialog box with the input values that define the worst case, and press the Add option to add another scenario. Click on OK, and the Worst Case scenario will be successfully created.
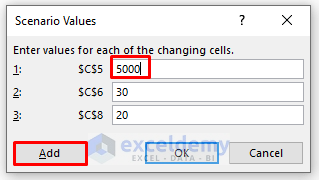
- Since we’d like to create another scenario, we click on Add. After clicking on Add, another Add Scenario dialogue box will appear. Use the same approach that we applied when creating the Worst Case scenario to build the Best Case scenario. Please note that Excel has set changing cells for the worst-case scenario as the default changing cells for the best-case scenario. The details are given in the following screenshot.
- With the same approach, create the Most Likely Case Here the below screenshot presents the details.
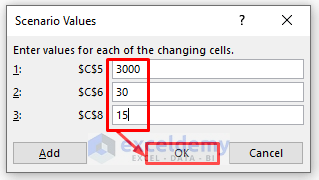
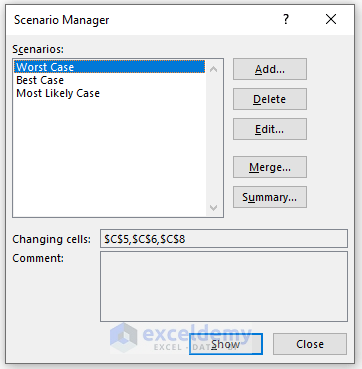
- You can also use the same above approach to creating other scenarios if you have other combinations of input values. In this example, we assume that there are only 3 scenarios available and thus we click on the OK button in the Scenario Values dialogue box. Now, you can see that three scenarios have been successfully created and they are listed in sequence. Click on Close, and the Scenario Manager dialogue box will be closed.
Read More: How to Create Scenarios in Excel
Step 3: View Different Scenarios
So far, you have saved all of those 3 scenarios in your workbook. If you go to the Data tab and click on What-If Analysis in Forecast Group, then choose Scenario Manager in the drop-down, you will see the same Scenario Manager dialogue box as that is shown in the below screenshot.

The Scenario Manager dialogue box is no longer blank. Now you can view the result from each of the scenarios by simply double-clicking on any scenario.
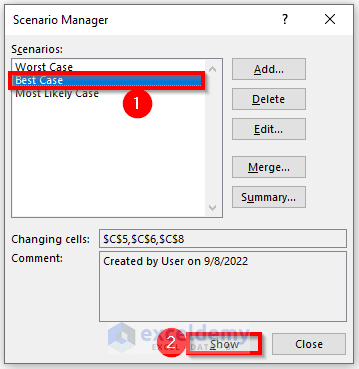
For example, if we double-click on Worst-Case, the input values in the Excel worksheet will change into what has been filled for Worst Case, and the output value will be calculated automatically based on the formula in cell C9. To view a specific scenario and its corresponding outputs, you can also click on that scenario and then click on the Show button at the bottom. The right part in the below screenshot shows how the Excel worksheet looks like if we click on Best Case scenario and then click on Show. The dataset will change automatically.
Step 4: Create Scenario Summary Report in Excel
I have already told you in the introduction part that Excel can create a summary report based on the saved scenarios. Now let’s see how to make a summary report. To do that, follow the instructions below:
- First of all, from your Data tab, go to,
Data → Forecast → What-If Analysis → Scenario Manager
- After that, a Scenario Manager dialogue box will appear in front of you. From the Scenario Manager dialog box, click on the Summary option.
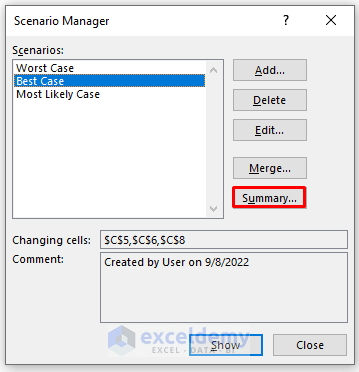
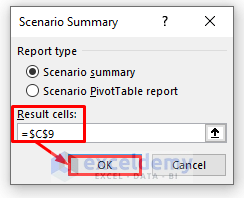
- After clicking on Summary, a Scenario Summary dialog box appears for you to put Result cells (C9 in this case) and choose between Scenario summary. At last, press the OK option.
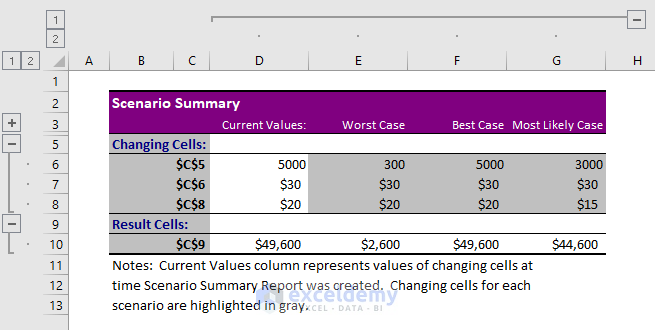
- As a result, you will be able to create the scenario summary report.
I hope these steps are suitable enough to teach you how to use scenario manager in Excel quite efficiently.
Read More: How to Create a Scenario Summary Report in Excel
Notes on How to Use Scenario Manager in Excel
- It’s hard to create lots of scenarios with the Scenario Manager because you need to input each individual scenario’s input values. The work will be time-consuming and also expose you to a high risk of making a mistake.
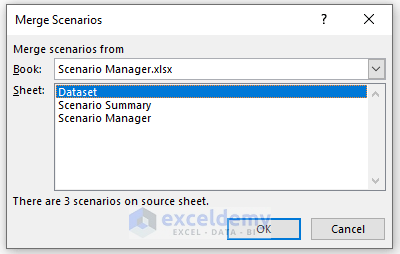
- Suppose that you send a file to several people and ask them to add their own scenarios. After you receive all workbooks, you can merge all the scenarios into one workbook. Open each person’s workbook and click the Merge button in the Scenario Manager dialog box in the original workbook. In the Merge Scenarios dialog box, select the workbook containing the scenarios that you want to merge. Do the same things with all of the workbooks. The below screenshot shows you how to choose the workbook in the Merge Scenarios dialog box.
Things to Remember
➜ While a value can not found in the referenced cell, the #N/A! error happens in Excel.
➜ The #VALUE! error occurs when any of the given inputs are non-numeric.
Download Practice Workbook
Download this practice workbook to exercise while you are reading this article.
Conclusion
I hope all of the suitable methods mentioned above on how to use scenario manager in Excel will now provoke you to apply them in your spreadsheets with more productivity. You are most welcome to feel free to comment if you have any questions or queries.
Related Articles
- How to Create a Scenario with Changing Cells in Excel
- How to Edit Scenarios in Excel
- How to Remove Scenario Manager in Excel
<< Go Back to Excel What-If Analysis Scenario Manager | What-If Analysis in Excel | Learn Excel
Get FREE Advanced Excel Exercises with Solutions!

Excellent presentation.
Thanks for your recognition.
Thanks, Sam! I will reach it to Zhiping 🙂