Finding a means to determine the “typical” value is something you might frequently do while evaluating numerical data. You can use the so-called measures of central tendency for this purpose, which represent a single value designating the middle or center of a statistical distribution or, more precisely, the central location inside a data set. They are sometimes categorized as summary statistics. Mean, Median, and Mode are the three primary metrics for assessing central tendency. Each of them provides a distinct indication of a typical value and depending on the situation, some measures are more appropriate to use than others. They are all valid measurements of the central position. In this article, we will show you how to find the Mean, Median, and Mode on Excel.
How to Find Mean, Median, and Mode on Excel: 3 Easy Ways
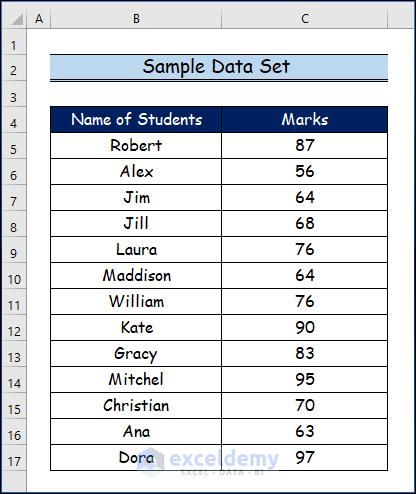
The terms “measures of central tendency” are frequently used to describe the mean, median, and mode, which provide details about a distribution’s center. In the following methods, you will learn to calculate the Mean using the AVERAGE function, determine the Median utilizing the MEDIAN function and evaluate the Mode applying the MODE.SNGL function and the MODE.MULT function in Excel. Let’s suppose we have a sample data set.
1. Utilizing AVERAGE Function to Find Mean in Excel
The average of a set of numbers is referred to as the arithmetic mean, and it is calculated by adding all the numbers in the data set and then dividing by the count of the actual numbers in the data set. With the average, the advantage is that all the numbers in the data set are incorporated in the final computation. The disadvantage of the average is that very large or very small values can distort the average value. These values are referred to as outliers, and they have the most significant impact on the average value.
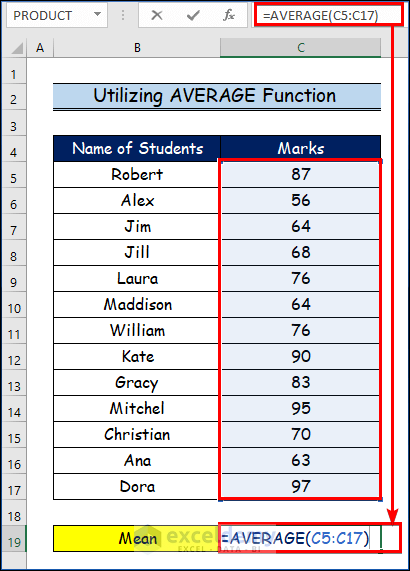
- Firstly, choose the C19 cell.
- Then, write down the following formula by selecting the range from C5 to C17 to calculate the mean.
=AVERAGE(C5:C17)- Besides, click ENTER.
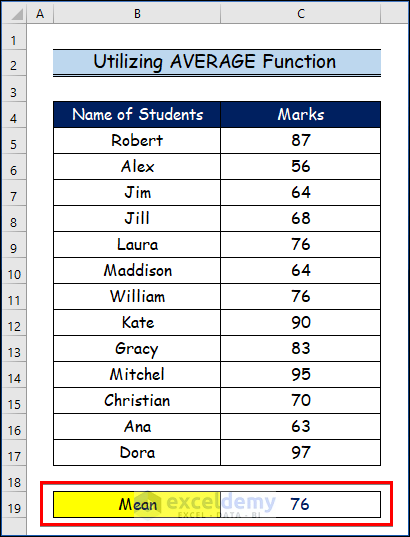
- Finally, you will see the following result for the mean value in the below image.
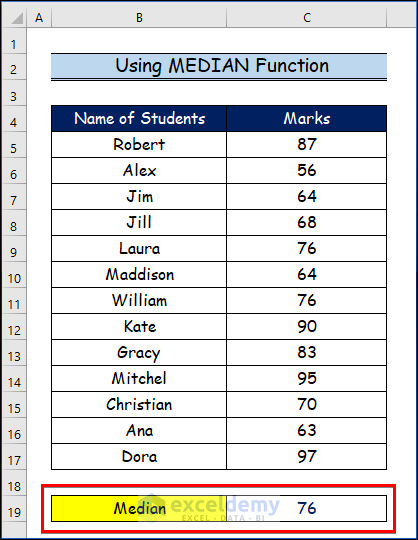
2. Using MEDIAN Function to Calculate Median in Excel
The median describes the value that is at the center of the data set. Half the numbers are greater than the median and the other half are less than the median. The median is not affected by outliers as much as the average is, which is an advantage. However, for very large data sets such as those obtained from a census, the median can take a long time to compute.
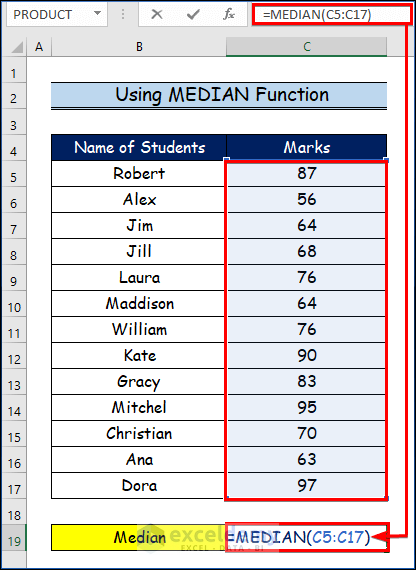
- Pick the C19 cell first.
- Then, use the range C5 to C17 to determine the median, and note down the formula below.
=MEDIAN(C5:C17)- Additionally, press ENTER.
- As a result, you will observe the final outcome of the median value here.
3. Applying MODE Function to Find Mode in Excel
The mode describes the value that occurs most often in a specific dataset. Later versions of Excel have two MODE functions, namely the MODE.SNGL function and the MODE.MULT function. The advantage of the mode is that it is not affected by outliers as dramatically as the average either. However, at times, a data set may not contain a mode.
3.1 Inserting MODE.SNGL Function
The MODE.SNGL function returns a single value, and this value is the most frequent value in the dataset.
- Select cell C19 first.
- After that, calculate the mode using the range C5 to C17 and write down the formula below.
=MODE.SNGL(C5:C17)- Then, click on the CTRL+ ENTER from the keyboard shortcut.
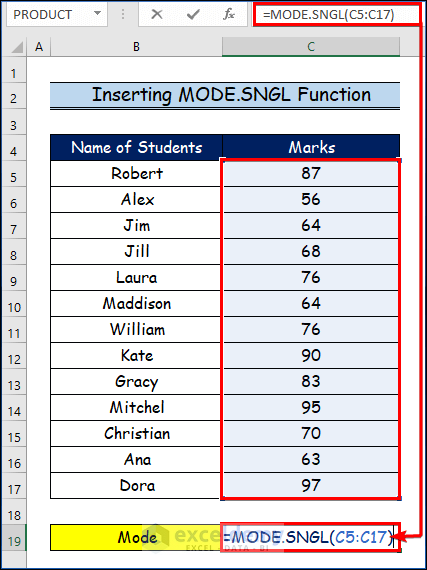
- Consequently, the below image displays the value of mode in the C19 cell here.

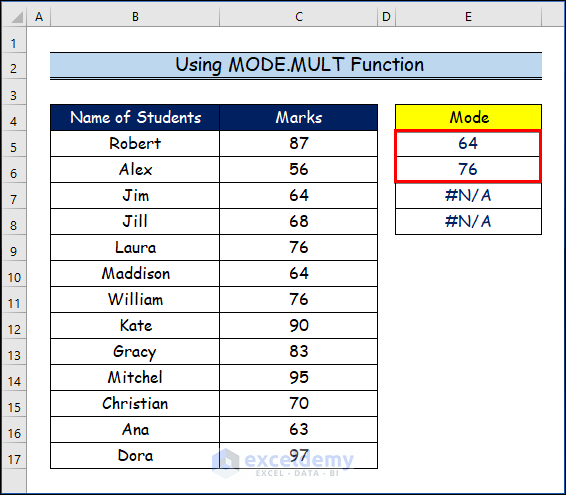
3.2 Using MODE.MULT Function
The MODE.MULT function returns a vertical array of the most frequently occurring values in a set. Sometimes data sets have more than one mode, so the MODE.MULT function accommodates this situation.
- Here, select some cells to use the MODE.MULT function.
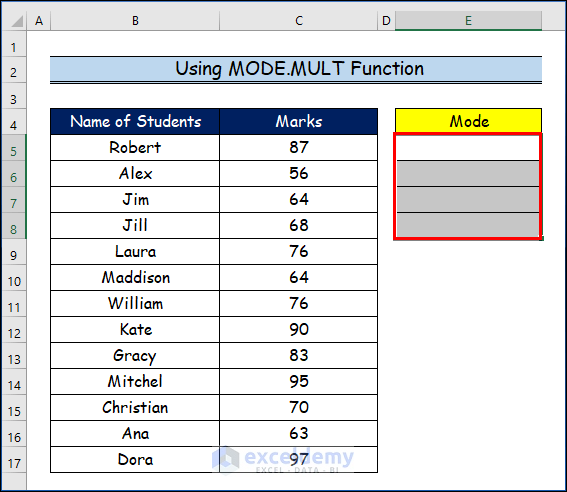
- Firstly, choose the C19 cell.
- Then, write down the following formula by choosing the range from C5 to C17 to evaluate the multiple modes of this range.
=MODE.MULT(C5:C17)- After that, press the CTRL+SHIFT+ENTER from the keyboard.

- Lastly, you will notice here that there are two modes for this range from C5 to C17 cell.
Read More: How to Calculate Margin of Error in Excel
Download Practice Workbook
You may download the following Excel workbook for a better understanding and to practice yourself.
Conclusion
In this article, we’ve covered 4 handy approaches to calculating mean, median, and mode in Excel. sincerely hope you enjoyed and learned a lot from this article. If you have any questions, comments, or recommendations, kindly leave them in the comment section below.
Related Articles
- How to Perform Bootstrapping in Excel
- How to Resample Time Series in Excel
- How to Calculate Bootstrapping Spot Rates in Excel
- Comparison Among MAX vs MAXA vs LARGE and MIN vs MINA vs SMALL Functions in Excel
<< Go Back to Excel for Statistics | Learn Excel
Get FREE Advanced Excel Exercises with Solutions!
